使用 Prometheus 监控
Prometheus是在云原生计算基金会管理下开发的一款开源监控软件。
Ozone 原生支持 Prometheus,各个组件会启动一个兼容 Prometheus 的指标端点,将所有可用的 hadoop 指标以 Prometheus 的格式导出发布。
准备
使用 Prometheus 进行监控
- 你需要在
ozone-site.xml文件中添加配置才可以启用 Prometheus 指标端点。
 <property>
   <name>hdds.prometheus.endpoint.enabled</name>
   <value>true</value>
 </property>
注意: 对于基于 docker-compose 方式的伪集群,在 docker-config 文件中添加 OZONE-SITE.XML_hdds.prometheus.endpoint.enabled=true。
-
重启 OM 和 SCM,检查端点:
-
http://scm:9876/prom
-
http://ozoneManager:9874/prom
-
根据这两个端点,创建 prometheus.yaml 配置文件:
global:
  scrape_interval: 15s

scrape_configs:
  - job_name: ozone
    metrics_path: /prom
    static_configs:
     - targets:
        - "scm:9876"
        - "ozoneManager:9874"
- 在 prometheus.yaml 文件所在目录启动 Prometheus:
prometheus
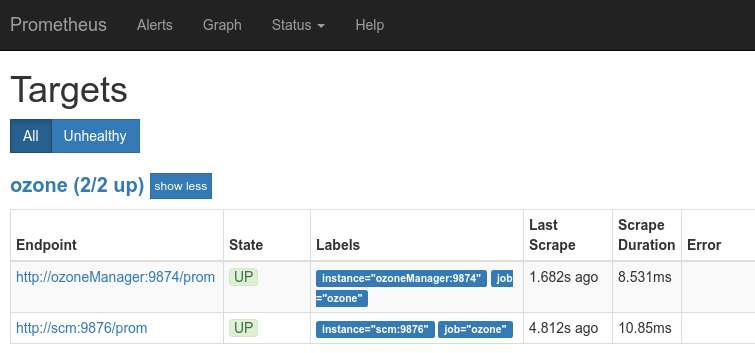
- 在 Prometheus 的 web ui 中查看目标:
http://localhost:9090/targets
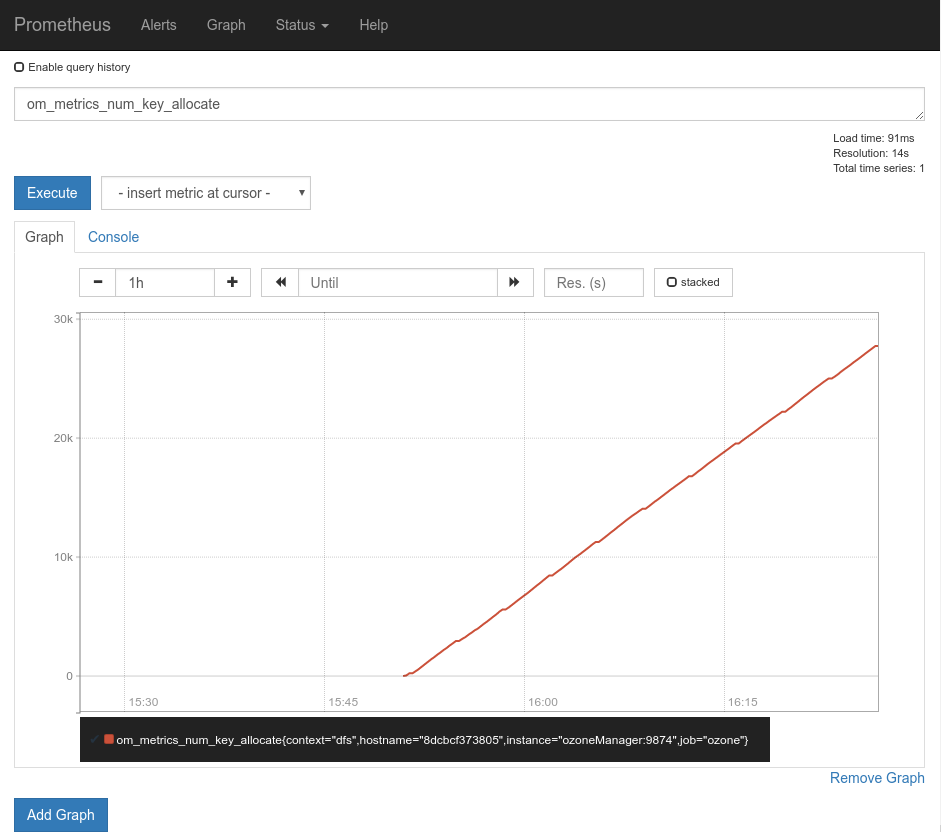
- 在 Prometheus web ui 中查看任意的指标,例如: For example:
http://localhost:9090/graph?g0.range_input=1h&g0.expr=om_metrics_num_key_allocate&g0.tab=1
注意事项
Ozone 发行包中包含了一个即开即用的容器化环境来试用 Ozone 和 Prometheus,在 compose/ozone 目录下。
cd compose/ozone
export COMPOSE_FILE=docker-compose.yaml:monitoring.yaml
docker-compose up -d