[HDDS-13679] Distributed Tracing using OpenTelemetry for Ozone (draft)
Distributed Tracing with OpenTelemetry
1. Introduction
Ozone currently utilizes OpenTracing with Jaeger for distributed tracing. However, the OpenTracing project is deprecated and no longer actively supported. This document proposes migrating from OpenTracing to OpenTelemetry, which is a standardized and actively maintained project supporting various tracing tools, including Jaeger.
The primary scope of this document is to detail the integration of OpenTelemetry for traces within the Ozone ecosystem.
2. OpenTelemetry Integration
This section outlines key OpenTelemetry concepts and their application within Ozone.
2.1. OpenTelemetry Concepts
2.1.1. Context
Context in OpenTelemetry keeps span and other information in the
context. Context is set to thread-local using context.makeCurrent(). And
the same can be retrieved using context.current().
Context Creation:
- Creating a span with noParent().
- Importing a trace from an external request.
- Manually creating a Context with parameters:
// Manual trace context creation
Context rootContext = Context.root();
Context newContextFromRoot = rootContext.with(myKey, "anotherValue");
Inter-thread Transfer: Context can be transferred between threads by explicitly setting the context in the target thread using context.makeCurrent().
Inter-process Transfer: Context needs to be retrieved and set to headers for HTTP or message body in gRpc to transfer. Further details are provided in Trace Propagation.
2.1.2. Span
An OpenTelemetry span represents a single, logical unit of work within a distributed system. It captures essential details of an operation.
- Name
- Parent span ID (absent for root spans)
- Start and End Timestamps
- Span Context
- Attributes
- Span Events
- Span Links
- Span Status
A span is initiated with startSpan() and concluded with end(). Spans are
organized hierarchically within a context, allowing for the creation of
child spans. For a span to be active and allow the creation of child
spans, it must be set to the current context using span.makeCurrent().
Example Span Structure:
| Field | Description |
|---|---|
| name | The name of the operation. |
| context | Contains trace_id and span_id. |
| parent_id | The ID of the parent span, or null for a root span. |
| start_time | Timestamp when the span began. |
| end_time | Timestamp when the span ended. |
| attributes | Key-value pairs providing additional details about the span. |
| events | An array of events that occurred during the span’s lifetime. Each event has a name, timestamp, and optional attributes. |
Upon completion (end()), span information is transmitted to the
OpenTelemetry Collector. This transmission occurs in batches for
performance optimization.
Sample:
{
  "name": "hello",
  "context": {
    "trace_id": "5b8aa5a2d2c872e8321cf37308d69df2",
    "span_id": "051581bf3cb55c13"
  },
  "parent_id": null,
  "start_time": "2022-04-29T18:52:58.114201Z",
  "end_time": "2022-04-29T18:52:58.114687Z",
  "attributes": {
    "http.route": "some_route1"
  },
  "events": [
    {
      "name": "Guten Tag!",
      "timestamp": "2022-04-29T18:52:58.114561Z",
      "attributes": {
        "event_attributes": 1
      }
    }
  ]
}
2.1.3. Scope
Scope in OpenTelemetry defines which span is considered “active” within a given thread or execution context.
-
context.makeCurrent()returns a Scope object, setting the context as thread-local. This context can be retrieved viaContext.current(). -
span.makeCurrent()returns a Scope object, setting the span within the context. This span can be retrieved viaSpan.current().
It is crucial to close the Scope object to release associated memory from the context or thread-local storage.
try (Scope scope = context.makeCurrent()) {
    Span span; // = get the space from context
    try (Scope spanScope = span.makeCurrent()) {
    }
}
2.1.4. Attributes
An OpenTelemetry span can include various attributes, which are key-value pairs that provide additional information about the operation being traced. Attributes enhance the observability of spans by adding context and detail that are crucial for debugging and performance analysis. They can represent anything from HTTP method and URL to database query parameters and user IDs.
Key Characteristics of Attributes:
-
Key-Value Pairs: Attributes are always stored as key-value pairs. Keys are typically strings, and values can be strings, booleans, numbers, or arrays of these types.
-
Semantic Conventions: OpenTelemetry defines a set of semantic conventions for common attributes (e.g., http.method, db.statement, error.type). Adhering to these conventions ensures consistency and improves compatibility with various tracing backends.
-
Immutability: Once set on a span, attributes are generally immutable. While new attributes can be added, existing ones are not typically modified.
Usage:
Attributes are typically added to a span during its creation or at any point before it ends.
Span span = tracer.spanBuilder("myOperation").startSpan();
try (Scope scope = span.makeCurrent()) {
    span.setAttribute("http.method", "GET");
    span.setAttribute("http.url", "/api/v1/data");
    span.setAttribute("user.id", "12345");
    // ... application logic ...
} finally {
    span.end();
}
Attributes are essential for filtering, querying, and analyzing traces in a tracing visualization tool like Jaeger, allowing developers to quickly pinpoint issues or understand the behavior of their distributed applications.
2.1.5. Events
Events are timestamped messages that provide a more granular view of what happened within a span’s lifetime. They can be used to mark significant moments, record errors, or capture specific data points during an operation.
Key Characteristics of Events:
-
Timestamped: Every event is associated with a specific timestamp, indicating when it occurred within the span.
-
Name: Each event has a descriptive name that summarizes what happened (e.g., “Cache hit,” “Database query started,” “Error”).
-
Attributes (Optional): Events can also include key-value attributes to provide additional context, similar to span attributes.
Usage:
Events are added to a span at the exact point in the code where the notable occurrence happens.
Span span = tracer.spanBuilder("myOperation").startSpan();
try (Scope scope = span.makeCurrent()) {
    // ... application logic ...
    span.addEvent("Processing started");
    // ... more application logic ...
    span.addEvent("Intermediate data generated", Attributes.of("data.size", 1024L));
    // ... further application logic ...
} finally {
    span.end();
}
Events are particularly useful for understanding the sequence of operations within a span, especially when debugging complex workflows or analyzing performance characteristics at a micro-level.
2.1.6. Trace Propagation
Trace propagation facilitates the transfer of trace context information within and across service boundaries.
Between Threads (within a single process):
-
Manual Transfer: The Context object can be manually transferred to a new thread, and makeCurrent() can be called on that thread.
-
Context Wrapping for Executor Services: Context.taskWrapping() can be used to wrap an ExecutorService, automatically propagating context to tasks executed by the service.
ExecutorService wrappedExecutor =
Context.taskWrapping(Executors.newFixedThreadPool(1));
Across a Network (between different services):
-
W3CTraceContextPropagator: This standard mechanism encodes trace information (Trace ID, Span ID, etc.) for transmission over a network, typically using HTTP headers. This can be used to write to StringBuilder or other output.
-
gRPC Integration for Ozone: For gRPC communications in Ozone, trace context can be encoded into a string and embedded within a Proto field (e.g., “traceId”). The receiving server can then decode this string back into a
Contextobject to continue the trace usingW3CTraceContextPropagator.
2.1.7. Trace Failure Handling
Failures within a traced operation can be recorded within the span by
setting its status. The SpanStatus enum provides predefined states like
OK, ERROR, and UNSET. Setting the status explicitly marks the span’s
outcome, which is critical for quick identification of issues in tracing
UIs. UNSET status is treated as success.
Normally below can be done to report failure:
-
Adding Events:
span.addEvent("Failure has occurred" + ex.getMessage)can be used to log a specific failure event with a descriptive message. This is timestamped information when failure occurred. -
Setting Status:
span.setStatus(StatusCode.ERROR)explicitly marks the span as having encountered an error.
Alternative, span.setStatus(StatusCode.ERROR, "error message") can be used but it will lack the timestamp.
Correctly setting the span status helps in filtering and aggregating error traces, providing a clear overview of system health and facilitating debugging efforts.
2.2. Integration with Ozone
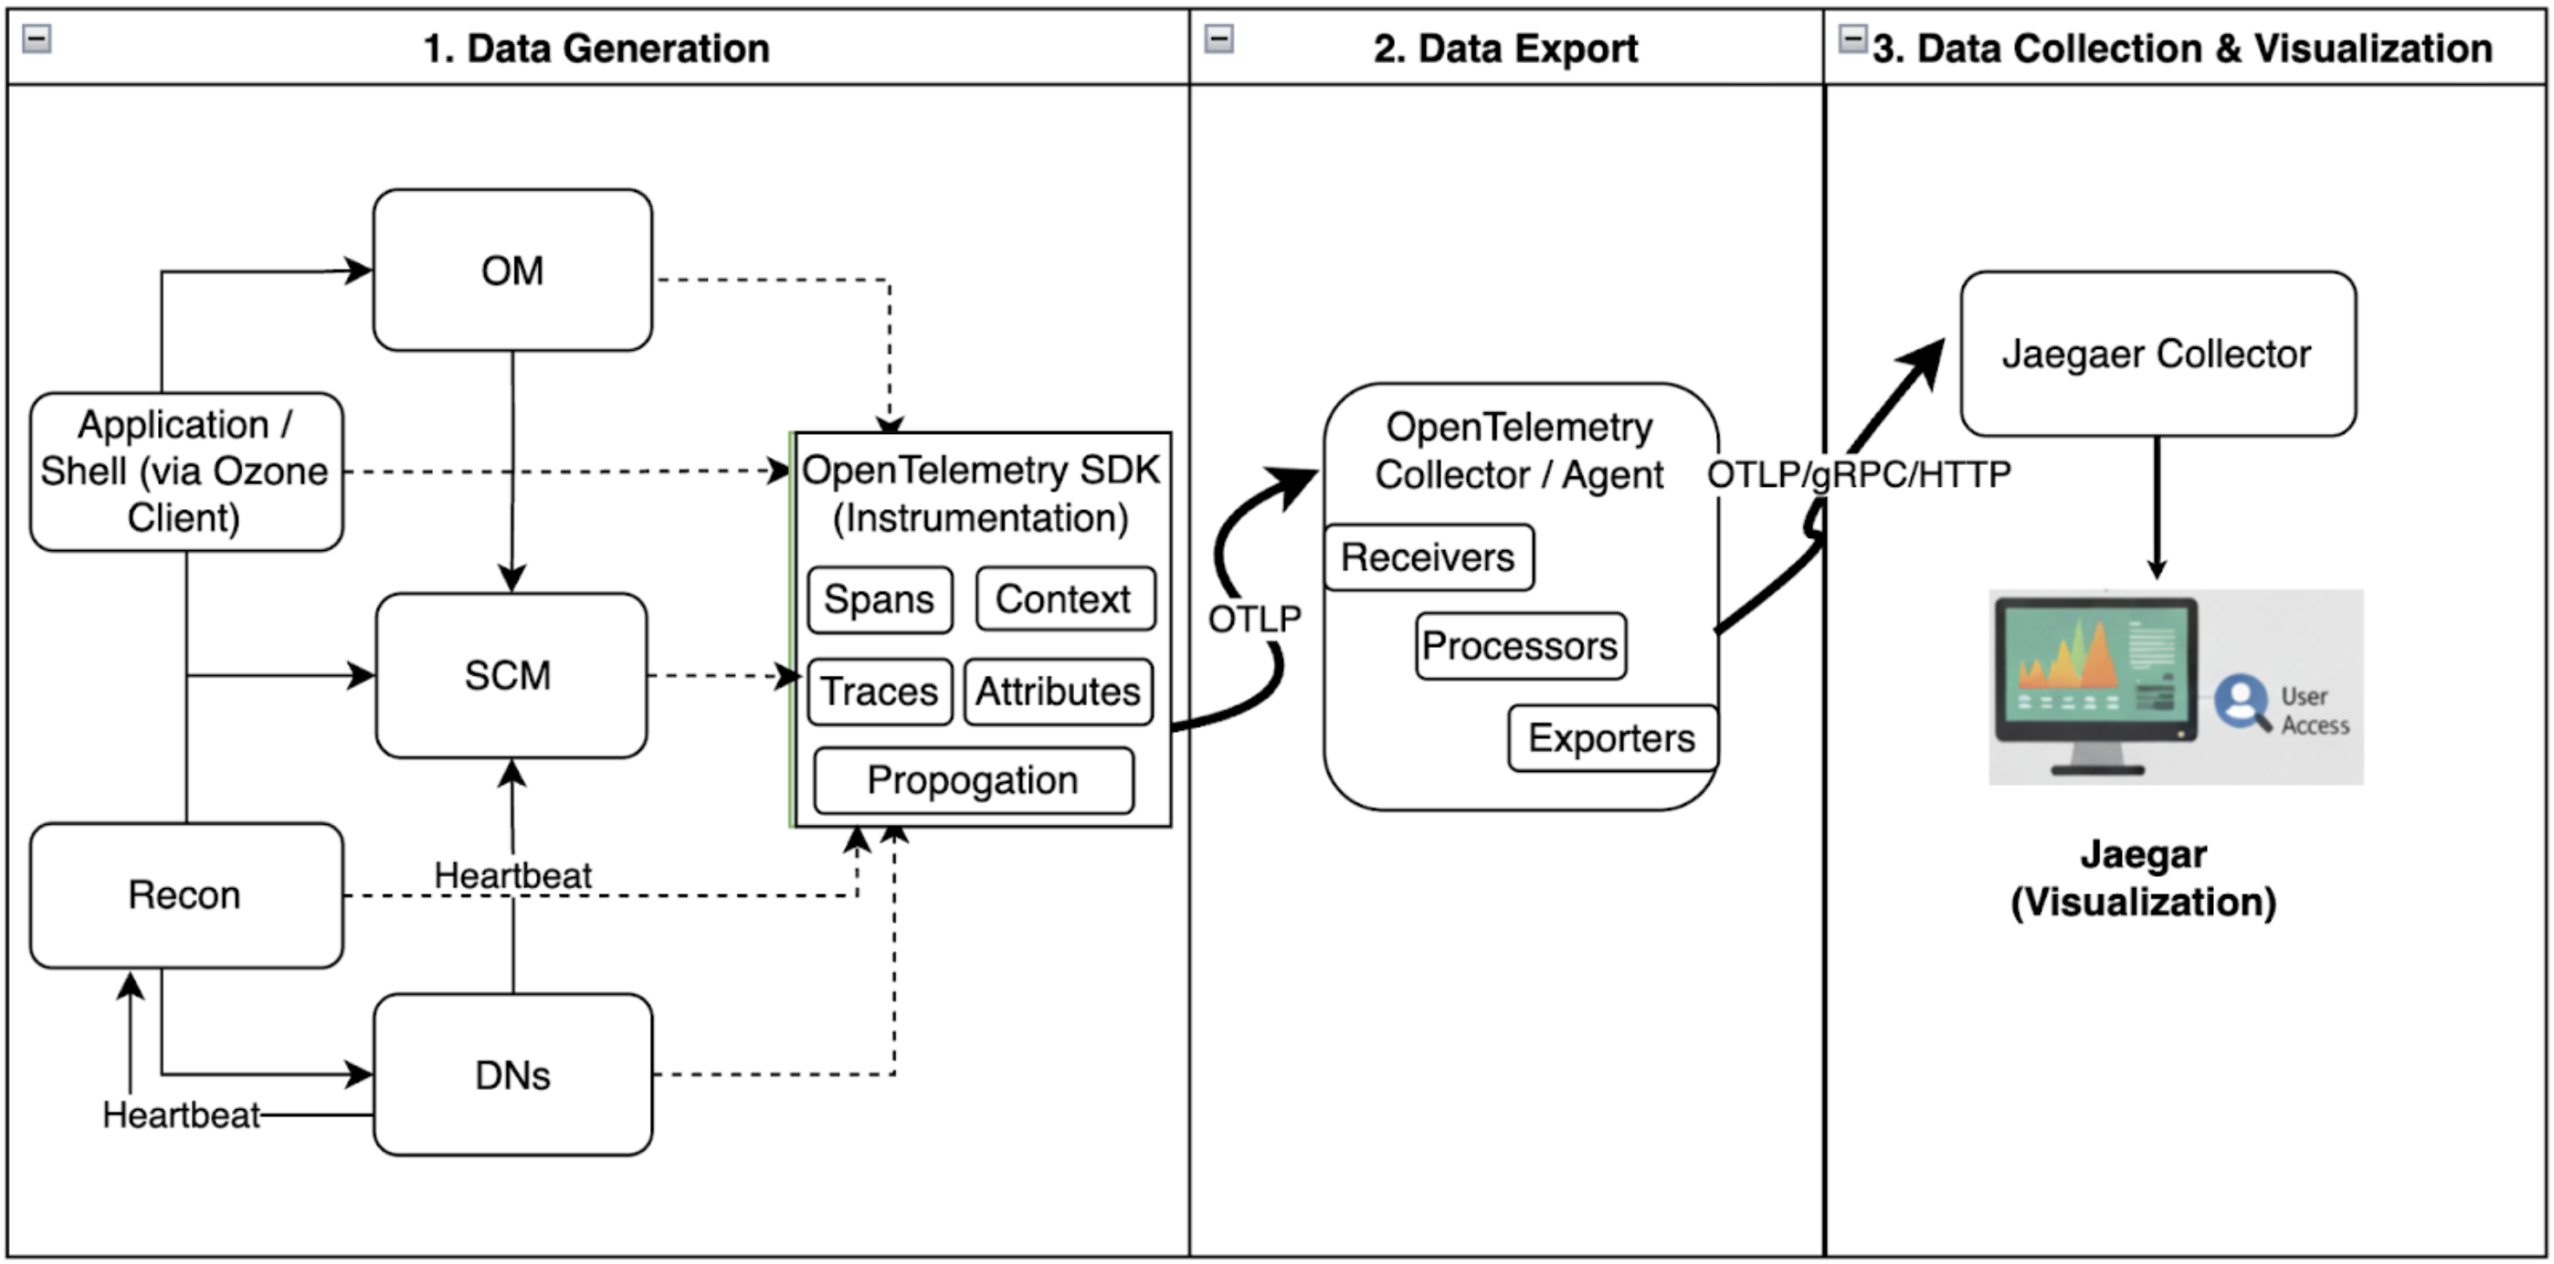
The OpenTelemetry SDK is integrated with Ozone Manager, leveragingContext, Span, and Scope concepts,
and configured to send traces to a Collector.
Ozone utilizes OTLP (OpenTelemetry Protocol) to transmit traces to a Collector, which can be an OpenTelemetry Collector, Jaeger, or any other collector supporting OpenTelemetry standards.
For Ozone, data can be exported directly to the Jaeger collector, as no processing is required. But the above approach can help in exporting to different vendors in multiple formats for visualization and other purposes.
The following environment variables are used for Collector configuration:
- OTEL_EXPORTER_OTLP_ENDPOINT: Specifies the endpoint of the OTLP receiver. Default: http://localhost:4317.
- OTEL_TRACES_SAMPLER_ARG: Configures the trace sampler argument. Default: 1.0 (all traces are reported).
2.3. How OpenTelemetry Tracing Works
Tracing in OpenTelemetry involves a hierarchy of spans. A parent span (e.g., span1) can contain one or more child spans (e.g., span2). Upon completion, each span sends its details to the configured Collector endpoint. This process is batched by the SDK for performance.
Scenarios:
- Single-Node (Parent-Child):
span1.start()
    span2.start()
      // application code
    span2.end() → Sends span information to Collector (1)
span1.end() → Sends span information to Collector (2)
- Two-Node (Parent-Child with gRPC):
Node 1:
 span1.start()
   Generate trace context as String
   Add to gRPC Message and send message, then wait
Node 2:
Receive gRPC message and retrieve trace context as String
Convert to Context object and create span2 as child

span2.start()
       // application code
span2.end() → Sends span information to Collector (1)
Node 1:
span1.end() → Sends span information to Collector (2)
3. Tracing Hierarchy
The current tracing implementation in Ozone initiates traces for:
- Every remote call from the Ozone client and shell.
- Ozone Manager’s
get blockscalls to SCM. - Remote calls from the Ozone client to DataNode for put block.
This approach often results in disjoint traces or limited hierarchical representation, which does not provide a comprehensive view of end-to-end operational flows.
3.1. Goal for Enhanced Call Hierarchy
The objective is to unify disjoint remote calls into a single, cohesive parent trace, providing a complete flow representation. Specific goals include:
- Combining all disjoint remote calls from the client into a single parent trace (e.g., for file create, write, and commit operations).
- Including communication with SCM during file creation or allocation flows.
- Integrating DataNode write operations into the same end-to-end trace.
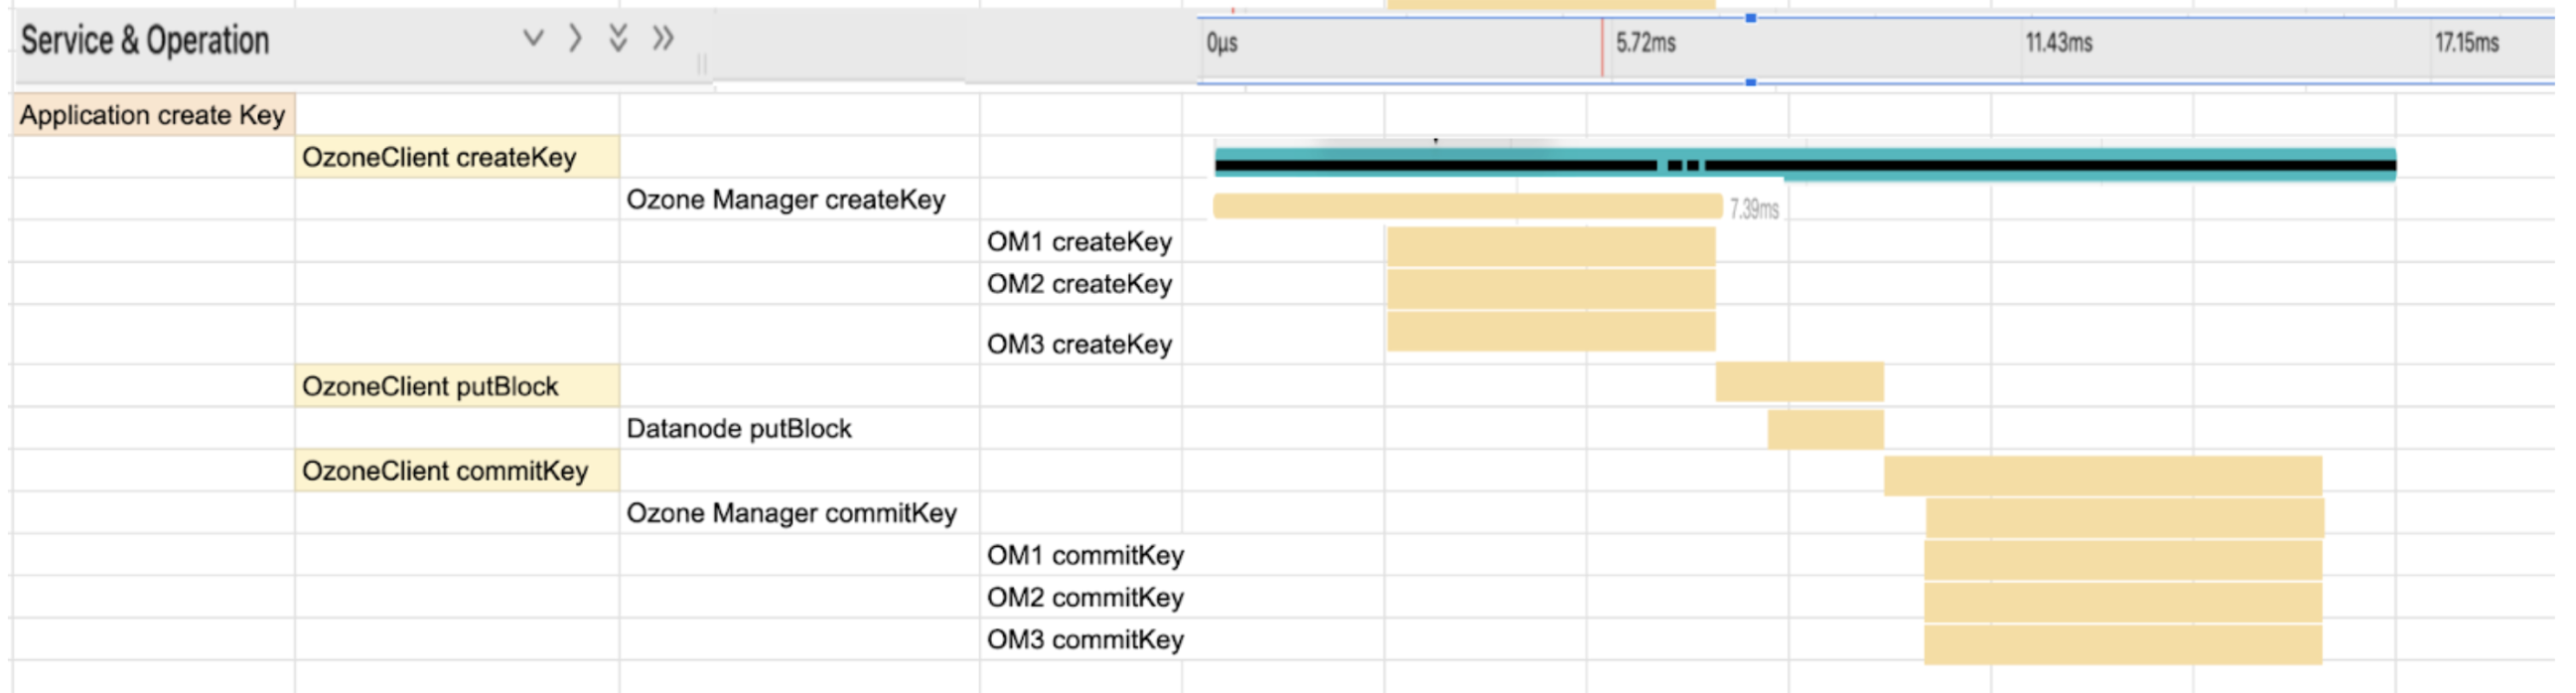
Example End-to-End Trace Flow:
- Application starts “create key” operation
- Ozone client “create key”
- Ozone Manager receives “create key”
- Executed on all 3 Ozone Managers
- Ozone Manager receives “create key”
- Ozone client “put block for write”
- DataNode “put block”
- Ozone Client “commit key”
- Ozone Manager receives “commit key”
- Executed on all 3 Ozone Managers
- Ozone Manager receives “commit key”
- Ozone client “create key”
- Finishes “create key” operation
3.2. Integration of More Flows
For comprehensive performance analysis and debugging, tracing can be extended to various additional flows:
- DataNode Heartbeat to SCM: Trace recording should only occur when the DataNode initiates the trace context.
- Recon: Trace all requests from the Recon UI to Ozone components, such as the Recon Server.
- Internal Services (e.g., OM connecting to SCM): These calls, initiated under a timer thread, should also be traced.
For internal Ozone calls, the trace should be initiated by the caller as a Client span, not a Server span,
as these are not remote calls crossing service boundaries but rather operations controlled within Ozone components.
3.3. Use Case
This enhanced tracing capability can be integrated with applications such as HBase, Iceberg, and Impala, which support OpenTelemetry. This enables detailed visualization of time taken at each step of an operation, facilitating the identification of performance bottlenecks.
4. OpenTelemetry Span Kind
When a span is created, it is assigned a SpanKind to provide context to
the tracing backend regarding how the trace should be assembled.
- Client: Represents a synchronous outgoing remote call (e.g., an outgoing HTTP request or database query).
- Server: Represents a synchronous incoming remote call (e.g., an incoming HTTP request or remote procedure call).
- Internal: Represents operations that do not cross a process boundary (e.g., instrumenting a function call within the same service).
- Producer: Represents the creation of a job that may be processed asynchronously later (e.g., enqueueing a message into a message queue).
- Consumer: Represents the processing of a job initiated by a producer.
5. OpenTracing Control Level
Tracing of call flows can be categorized to enable fine-grained control:
- External Request Tracing: Traces initiated by external remote servers, such as those originating from the Ozone Client or the Recon UI.
- Internal Requests: Traces within Ozone components (e.g., OM to SCM), often initiated as part of a timer task.
A control flag is necessary to selectively enable tracing for external, internal, or other future categorizations, thereby managing the tracing overhead within Ozone services.
5. Dynamic Tracing Configuration
The following configuration property will control tracing:
- Ozone.tracing.enabled (default: false)
Existing environment variables for OpenTelemetry configuration are:
- OTEL_EXPORTER_OTLP_ENDPOINT: Specifies the OTLP receiver endpoint (default: http://localhost:4317/).
- OTEL_TRACES_SAMPLER_ARG: Sampler argument for traces (default: 1.0, meaning every trace is reported).
Since environment variables cannot be updated dynamically, dedicated configuration properties will be provided for dynamic control:
- ozone.tracing.endpoint
- ozone.tracing.sampler
These ozone.tracing configurations can be dynamically updated for Ozone Manager (OM), Storage Container Manager (SCM), and DataNode (DN) via the Ozone CLI.
Note: Dynamic updates are not feasible for the Ozone client as it is part of application code.
6. Tracing Support for Client
The Ozone client needs the flexibility to either initiate a new span or continue an existing application-level trace by creating a child span. A specific scenario arises when the Ozone client should only trace if it’s explicitly enabled to continue an application’s existing trace.
- Application with Active Trace:
- The Ozone client checks for an active span from the application’s context.
- If an active span is found, the Ozone client continues that trace as a child span, using the application’s existing trace context.
- Application Without Active Trace:
- If the application has not initiated a trace, the Ozone client will not create a new trace independently when
ozone.tracing.enabledis false.
- If the application has not initiated a trace, the Ozone client will not create a new trace independently when
Typically, ozone.tracing.enabled is false, indicating that no tracing should occur by default. However, for Ozone clients, dynamically
updating this configuration based on the application’s implementation is often not feasible.
To address this, the Ozone client will leverage the application’s tracer to continue tracing as a child span. This specific behavior will be controlled by an additional flag:
ozone.tracing.client.application-aware(default: true)
When Ozone.client.tracing.provider.application.enabled is true, the Ozone client will utilize tracers provided by the application context. This allows the Ozone client to trace even if the ozone.tracing.enabled configuration is false, provided the application has configured and enabled its own tracing.
Mechanism for Client-Side Trace Continuation:
// In a deep part of the code, get the current active span from the Context
Span currentSpan = Span.current();

// Get the tracer that created this span
Tracer tracer = currentSpan.getTracer();

// Using this tracer, a child span can be created and traced
// Example:
tracer.spanBuilder("OzoneClientOperation").setParent(currentSpan.getSpanContext()).startSpan();