Web UIs
Apache Ozone provides lightweight, read-only Web UIs for core services to support operational observability and troubleshooting. The primary service UIs are Storage Container Manager (SCM) and Ozone Manager (OM).
SCM Web UI
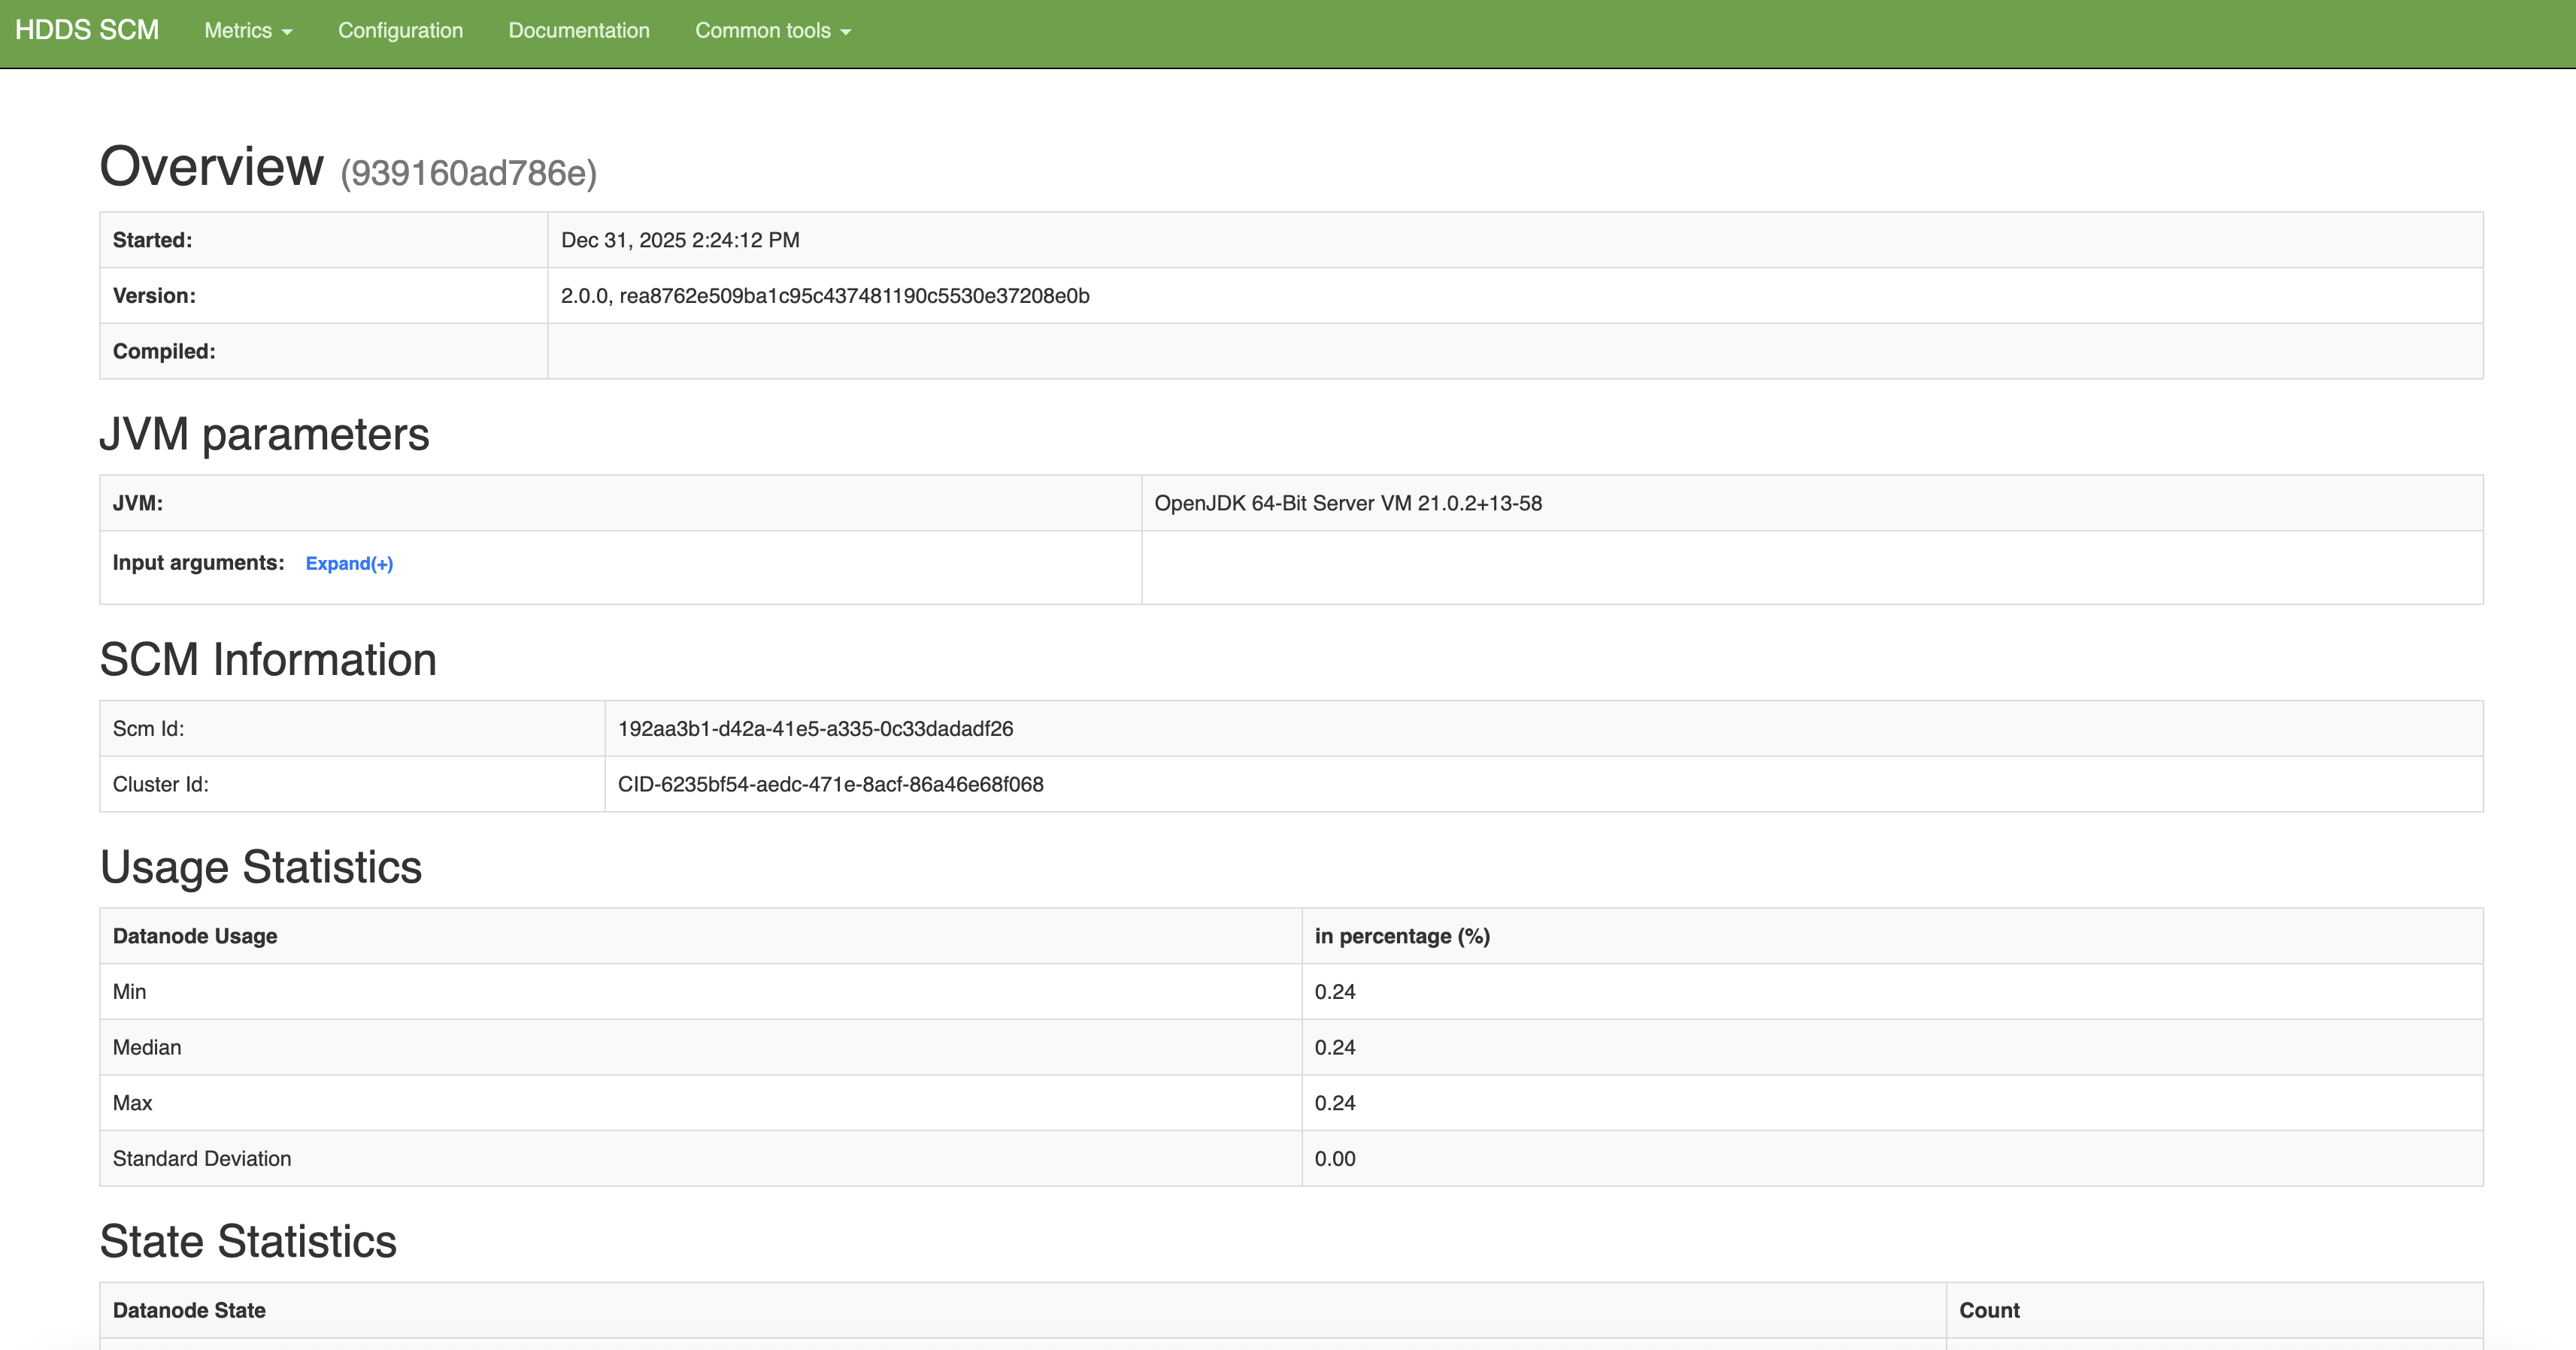
The SCM Web UI exposes the runtime state and health of the storage layer managed by SCM. At a high level, it provides:
- Service overview: SCM identity, version, JVM runtime, and cluster identifiers
- Cluster summaries: Aggregate statistics for Datanode usage, capacity, pipelines, and containers
- Datanode visibility: Per-node operational state, capacity usage, and heartbeat status
- Safemode and HA status: Safemode rule evaluation and readiness information in HA deployments
The SCM Web UI also includes RPC metrics, showing operation counts, average latency, and success/failure statistics for SCM RPC calls.
OM Web UI
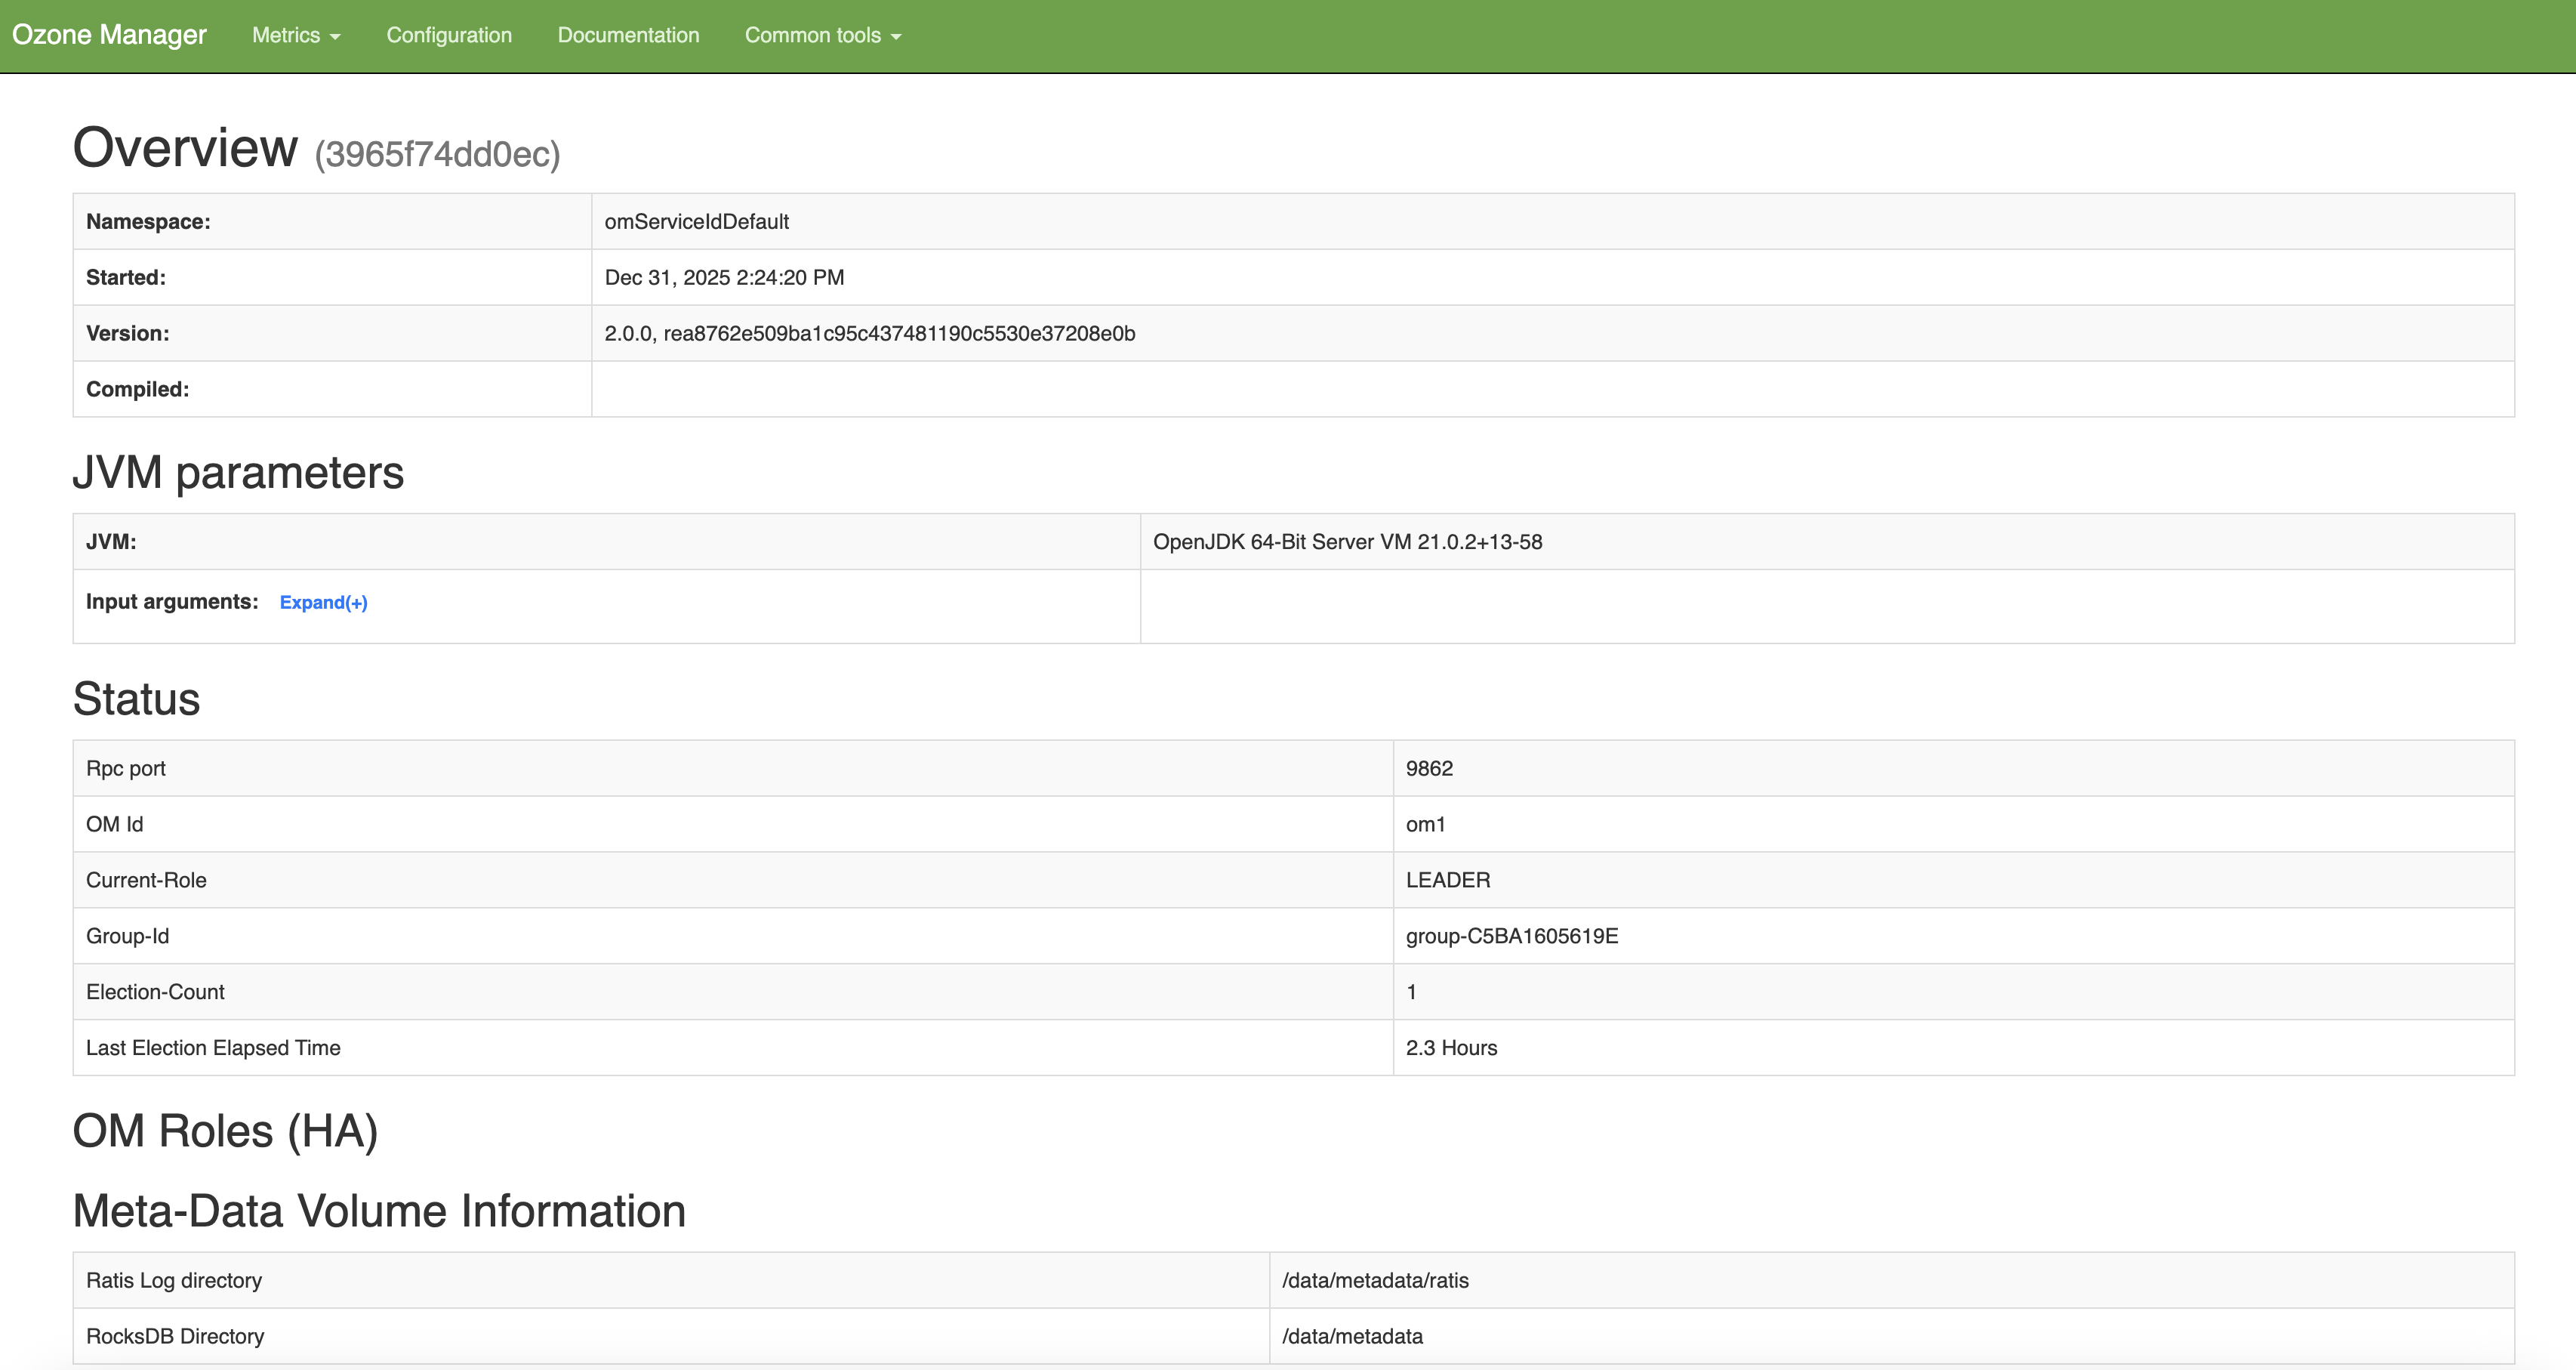
The Ozone Manager (OM) Web UI focuses on the metadata and namespace management layer. It provides:
- Service overview: OM identity, namespace, version, JVM runtime, and startup information
- HA and leadership status: Current role (leader/follower), election details, and group identifiers
- Metadata storage information: Ratis log and RocksDB directory locations
In addition to standard RPC metrics, the OM Web UI exposes OM-specific metrics related to metadata operations and namespace activity, enabling operators to observe OM behavior beyond raw RPC performance.
Common Metrics and Diagnostic Servlets
Both SCM and OM expose a common set of diagnostic endpoints and servlets:
- RPC Metrics – Number of operations, average latency, and success/failure counts
- JMX – JVM and service metrics via JMX
- Config – Effective runtime configuration of the service
- Stacks – Thread dump of the running process
- Log Level – View and dynamically adjust logging levels
These endpoints are primarily intended for debugging, diagnostics, and integration with external monitoring systems.