Recon UI — Datanodes Page
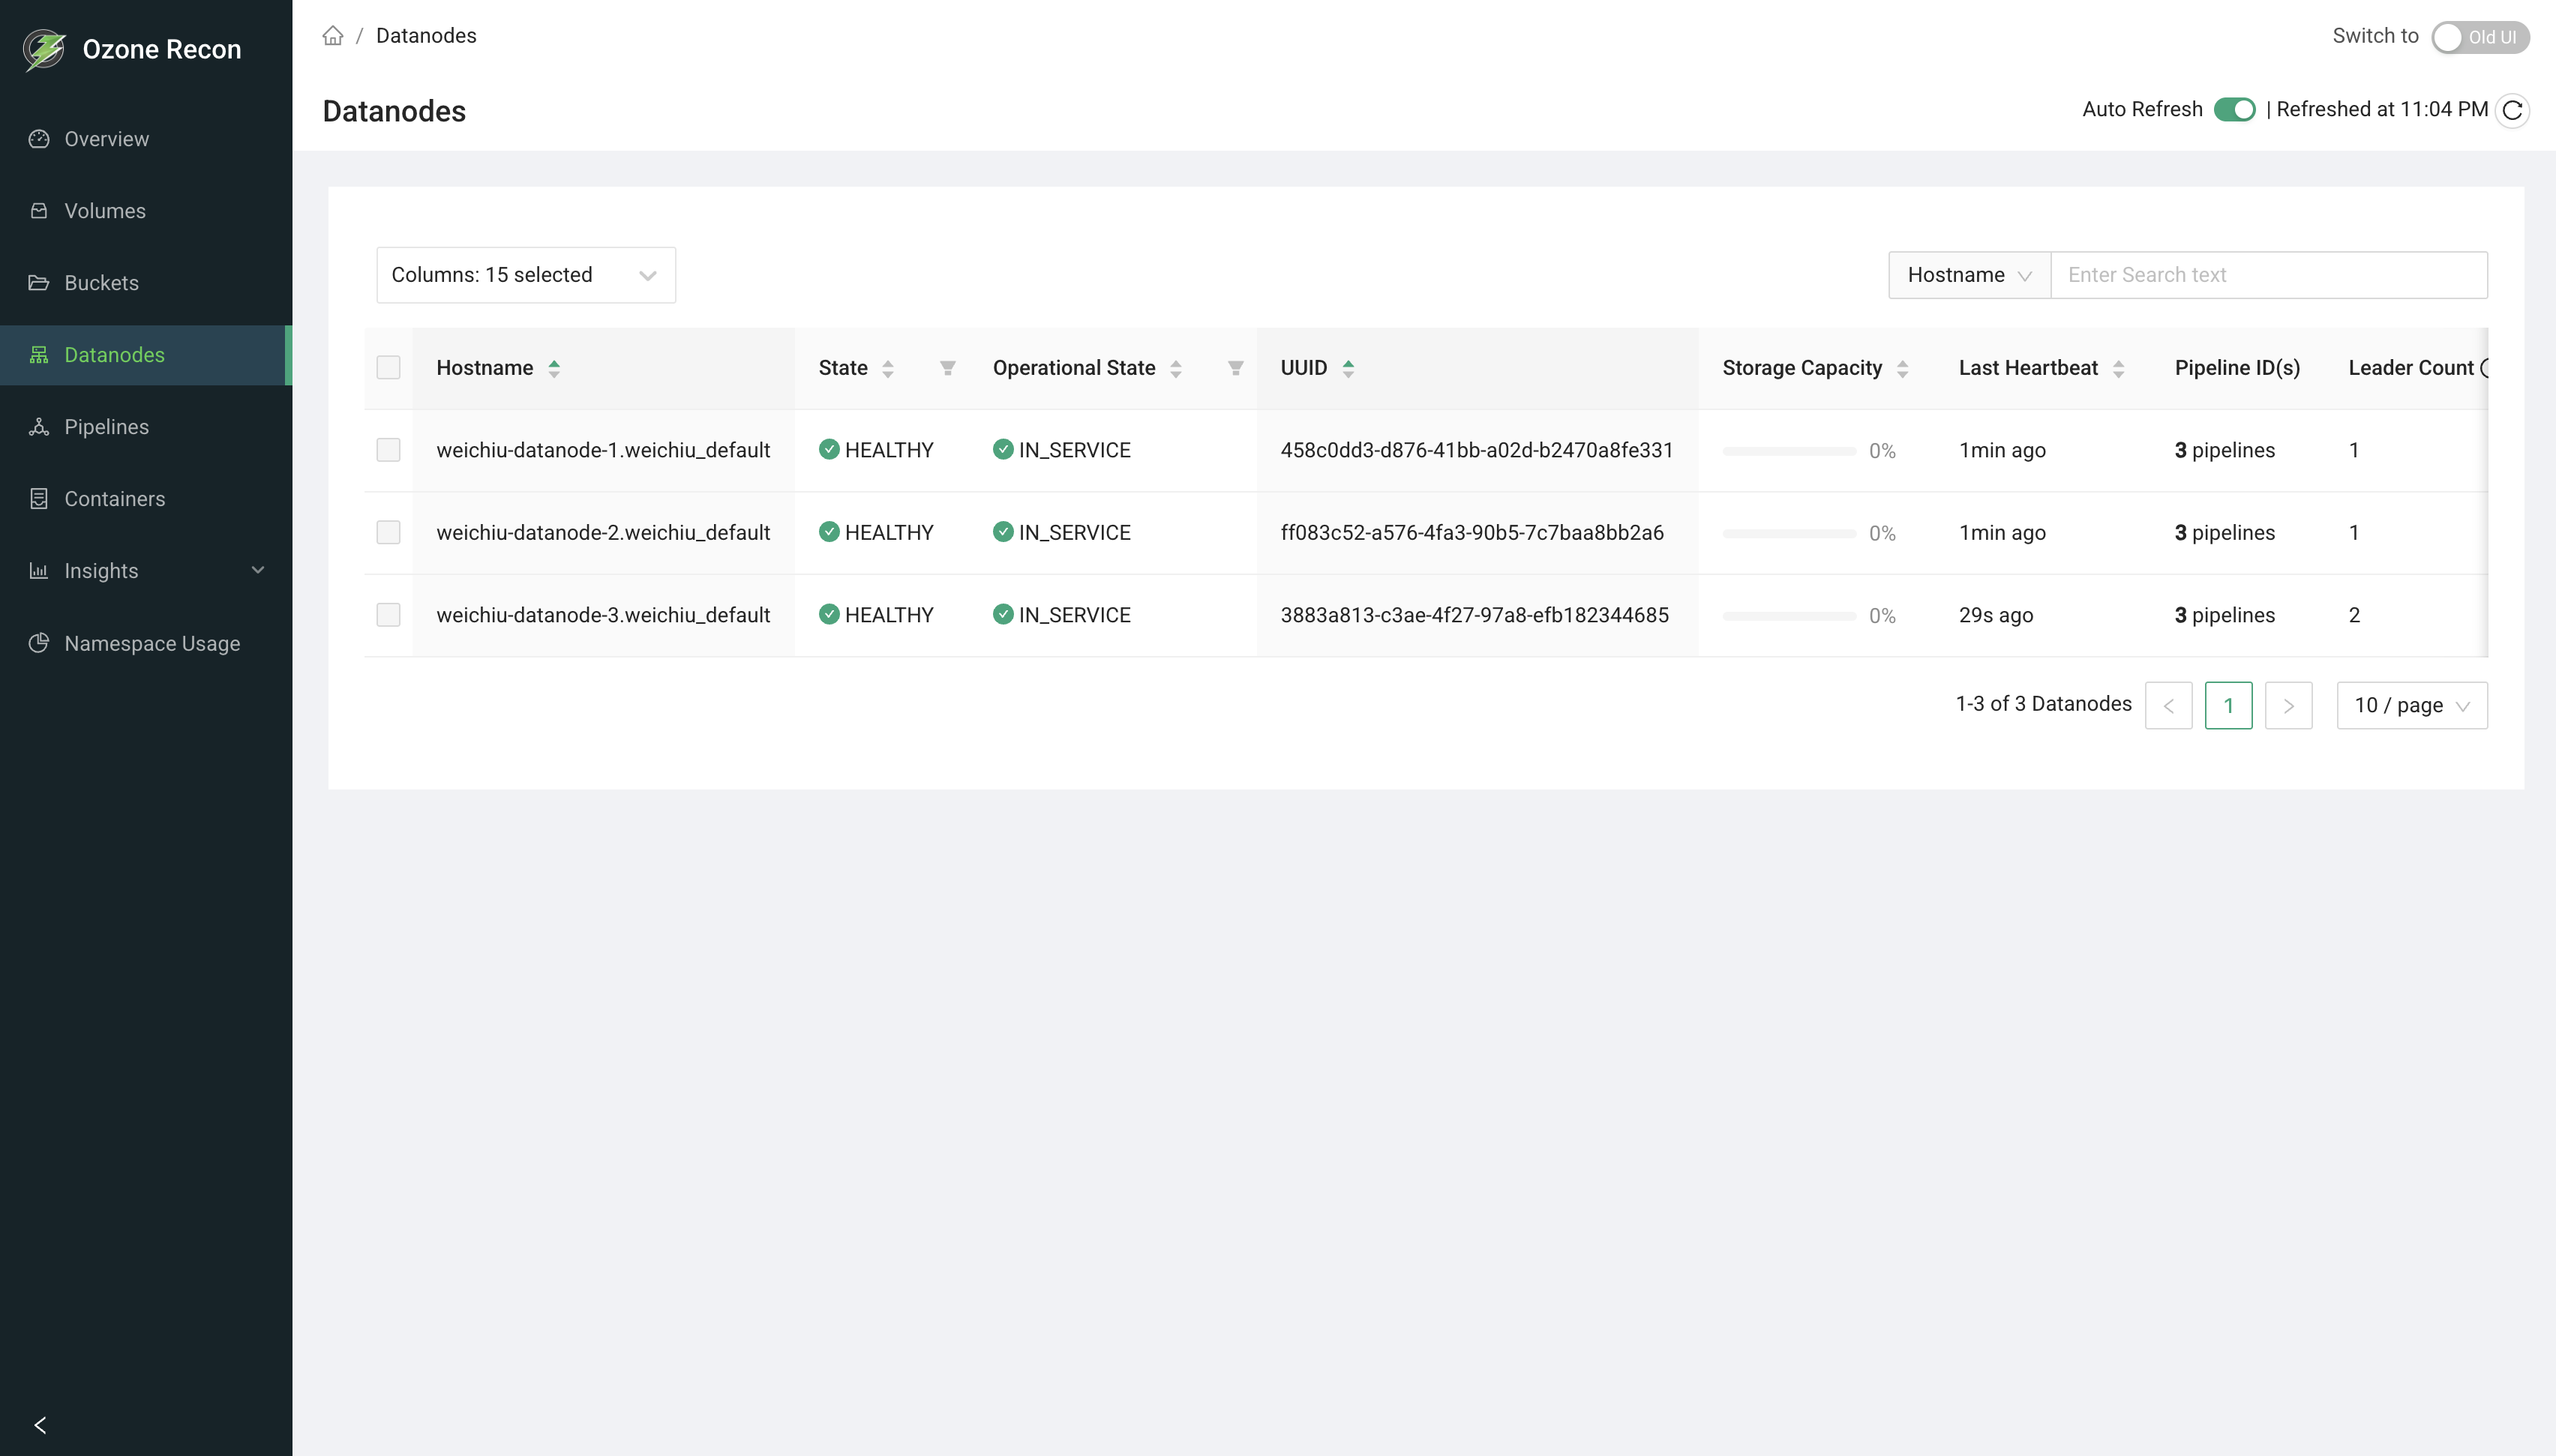
1. Page Overview
The Datanodes page lists every datanode Recon knows about and shows the health, operational state, storage usage, pipeline membership, container counts, and build information for each one. It is the main place to check datanode health and capacity across the cluster.
Besides browsing, the page lets you stop tracking datanodes that are no longer part of the cluster (removing dead nodes from Recon).
2. When to Use This Page
- To confirm all datanodes are healthy and in service.
- To find stale or dead datanodes and investigate them.
- To see which datanodes are being decommissioned or are in maintenance.
- To check per-datanode storage usage and spot nodes that are filling up.
- To see which pipelines a datanode participates in and how many it leads.
- To clean up Recon's view by removing datanodes that are permanently gone.
3. How to Access the Page
Open the Datanodes entry in the left navigation menu, or go to the
/Datanodes route directly. You can also arrive here from the Datanodes
health card on the Overview page.
4. Information Displayed
The page header shows the title and an Auto Reload panel (see Available Actions). The main area is a table of datanodes, one row per node.
Table columns
- Hostname — the datanode host (always shown, pinned to the left). Sortable.
- State — datanode health, with an icon:
- HEALTHY (green check) — heartbeating normally.
- STALE (hourglass) — heartbeats delayed.
- DEAD (red cross) — not heartbeating. Filterable and sortable.
- Operational State — the administrative state:
- IN_SERVICE (green check) — serving normally.
- DECOMMISSIONING (hourglass) — decommission in progress.
- DECOMMISSIONED (warning) — decommission complete.
- ENTERING_MAINTENANCE (hourglass) — entering maintenance.
- IN_MAINTENANCE (warning) — under maintenance. Filterable and sortable.
- UUID — the datanode's unique ID. For datanodes that are actively decommissioning, this cell shows a decommission summary instead of the plain ID.
- Storage Capacity — a bar showing used, committed, and remaining storage for the node. Sortable by remaining storage.
- Last Heartbeat — how long ago the node last reported in;
NAif never. - Pipeline ID(s) — the number of pipelines the node is in; hover to see the list, each with its replication type/factor and an indicator of whether this node is the pipeline leader.
- Leader Count — the number of Ratis pipelines in which this datanode is elected leader. Sortable.
- Containers — the number of containers on the node. Sortable.
- Open Container — the number of open containers per pipeline. Sortable.
- Version — the Ozone version running on the node. Sortable.
- Setup Time — when the node was set up;
NAif unavailable. - Revision — the build revision. Sortable.
- Build Date — the build date. Sortable.
- Network Location — the node's rack/network location. Sortable.
5. Available Actions
- Columns selector — choose which columns are visible. Hostname is always shown.
- Search — filter the shown rows by Hostname, UUID, or Version; matching is a simple contains match on the loaded rows. Disabled when the table is empty.
- State / Operational State filters — filter to specific values from those column headers.
- Sort — click a sortable column header.
- Pagination — page through results; page size is adjustable and the footer
shows the range and total (for example,
1-10 of 24 Datanodes). - Row selection + Remove — select one or more datanodes to reveal a red Remove button. Only DEAD datanodes can be selected; healthy or stale nodes cannot. Choosing Remove opens a Stop Tracking Datanode confirmation dialog before Recon stops tracking the selected node(s).
- Auto Reload panel — an Auto Refresh toggle (refreshes every 60 seconds and remembers your choice for the session; polling starts automatically on this page) and a manual reload button showing the last refreshed time.
- Pipeline popover — hover over the Pipeline ID(s) cell to see the node's pipelines and leadership.
6. How to Interpret the Information
- State HEALTHY: the node is heartbeating normally. STALE: heartbeats are late — the node may be under load or having network issues. DEAD: the node has stopped heartbeating and its data is treated as unavailable.
- Operational State: IN_SERVICE is the normal state. DECOMMISSIONING / DECOMMISSIONED mean the node is being or has been retired. ENTERING_MAINTENANCE / IN_MAINTENANCE mean it is temporarily out for maintenance.
- Storage Capacity bar: watch for nodes that are nearly full or unbalanced relative to others. Committed space is reserved but not yet written.
- Last Heartbeat: a large value (or
NA) alongside a STALE/DEAD state confirms the node is not reporting. - Leader Count: a very uneven leader distribution across nodes can indicate imbalance in Ratis leadership.
- Remove eligibility: the fact that only DEAD nodes can be selected is a safeguard — you cannot accidentally stop tracking a live node.
7. Common Use Cases
- Health sweep. Filter State to STALE and DEAD to immediately see any datanodes that are not healthy, then check their Last Heartbeat.
- Capacity check. Sort by Storage Capacity to find the fullest nodes and plan rebalancing or expansion.
- Clean up retired nodes. After a node is permanently removed from the cluster and shows as DEAD, select it and use Remove to stop Recon from tracking it.
8. Important Notes and Limitations
- Data source and freshness. Datanode information comes from Recon's own SCM view, which is built from datanode heartbeats and reports. State and storage figures are only as current as the last heartbeat, and Auto Refresh only re-queries Recon.
- Remove only affects Recon. Removing a datanode stops Recon from tracking it (it is removed from Recon's memory and its record in Recon's database). It does not decommission or delete the node in the cluster, and only DEAD nodes can be removed. If a removed node comes back and heartbeats, it can reappear.
- Decommission details for actively decommissioning nodes are shown in the UUID cell as a summary.
- Search and filters apply to the loaded rows.
- On an error, the page reports a data-fetch error and the table stays empty.
9. Related Pages
- Overview — the Datanodes health card and cluster-wide totals.
- Pipelines — details of the pipelines a datanode participates in.
- Containers — container-level detail, including missing containers.
- Capacity — cluster-wide storage and capacity breakdown.