Recon UI — Namespace Usage Page
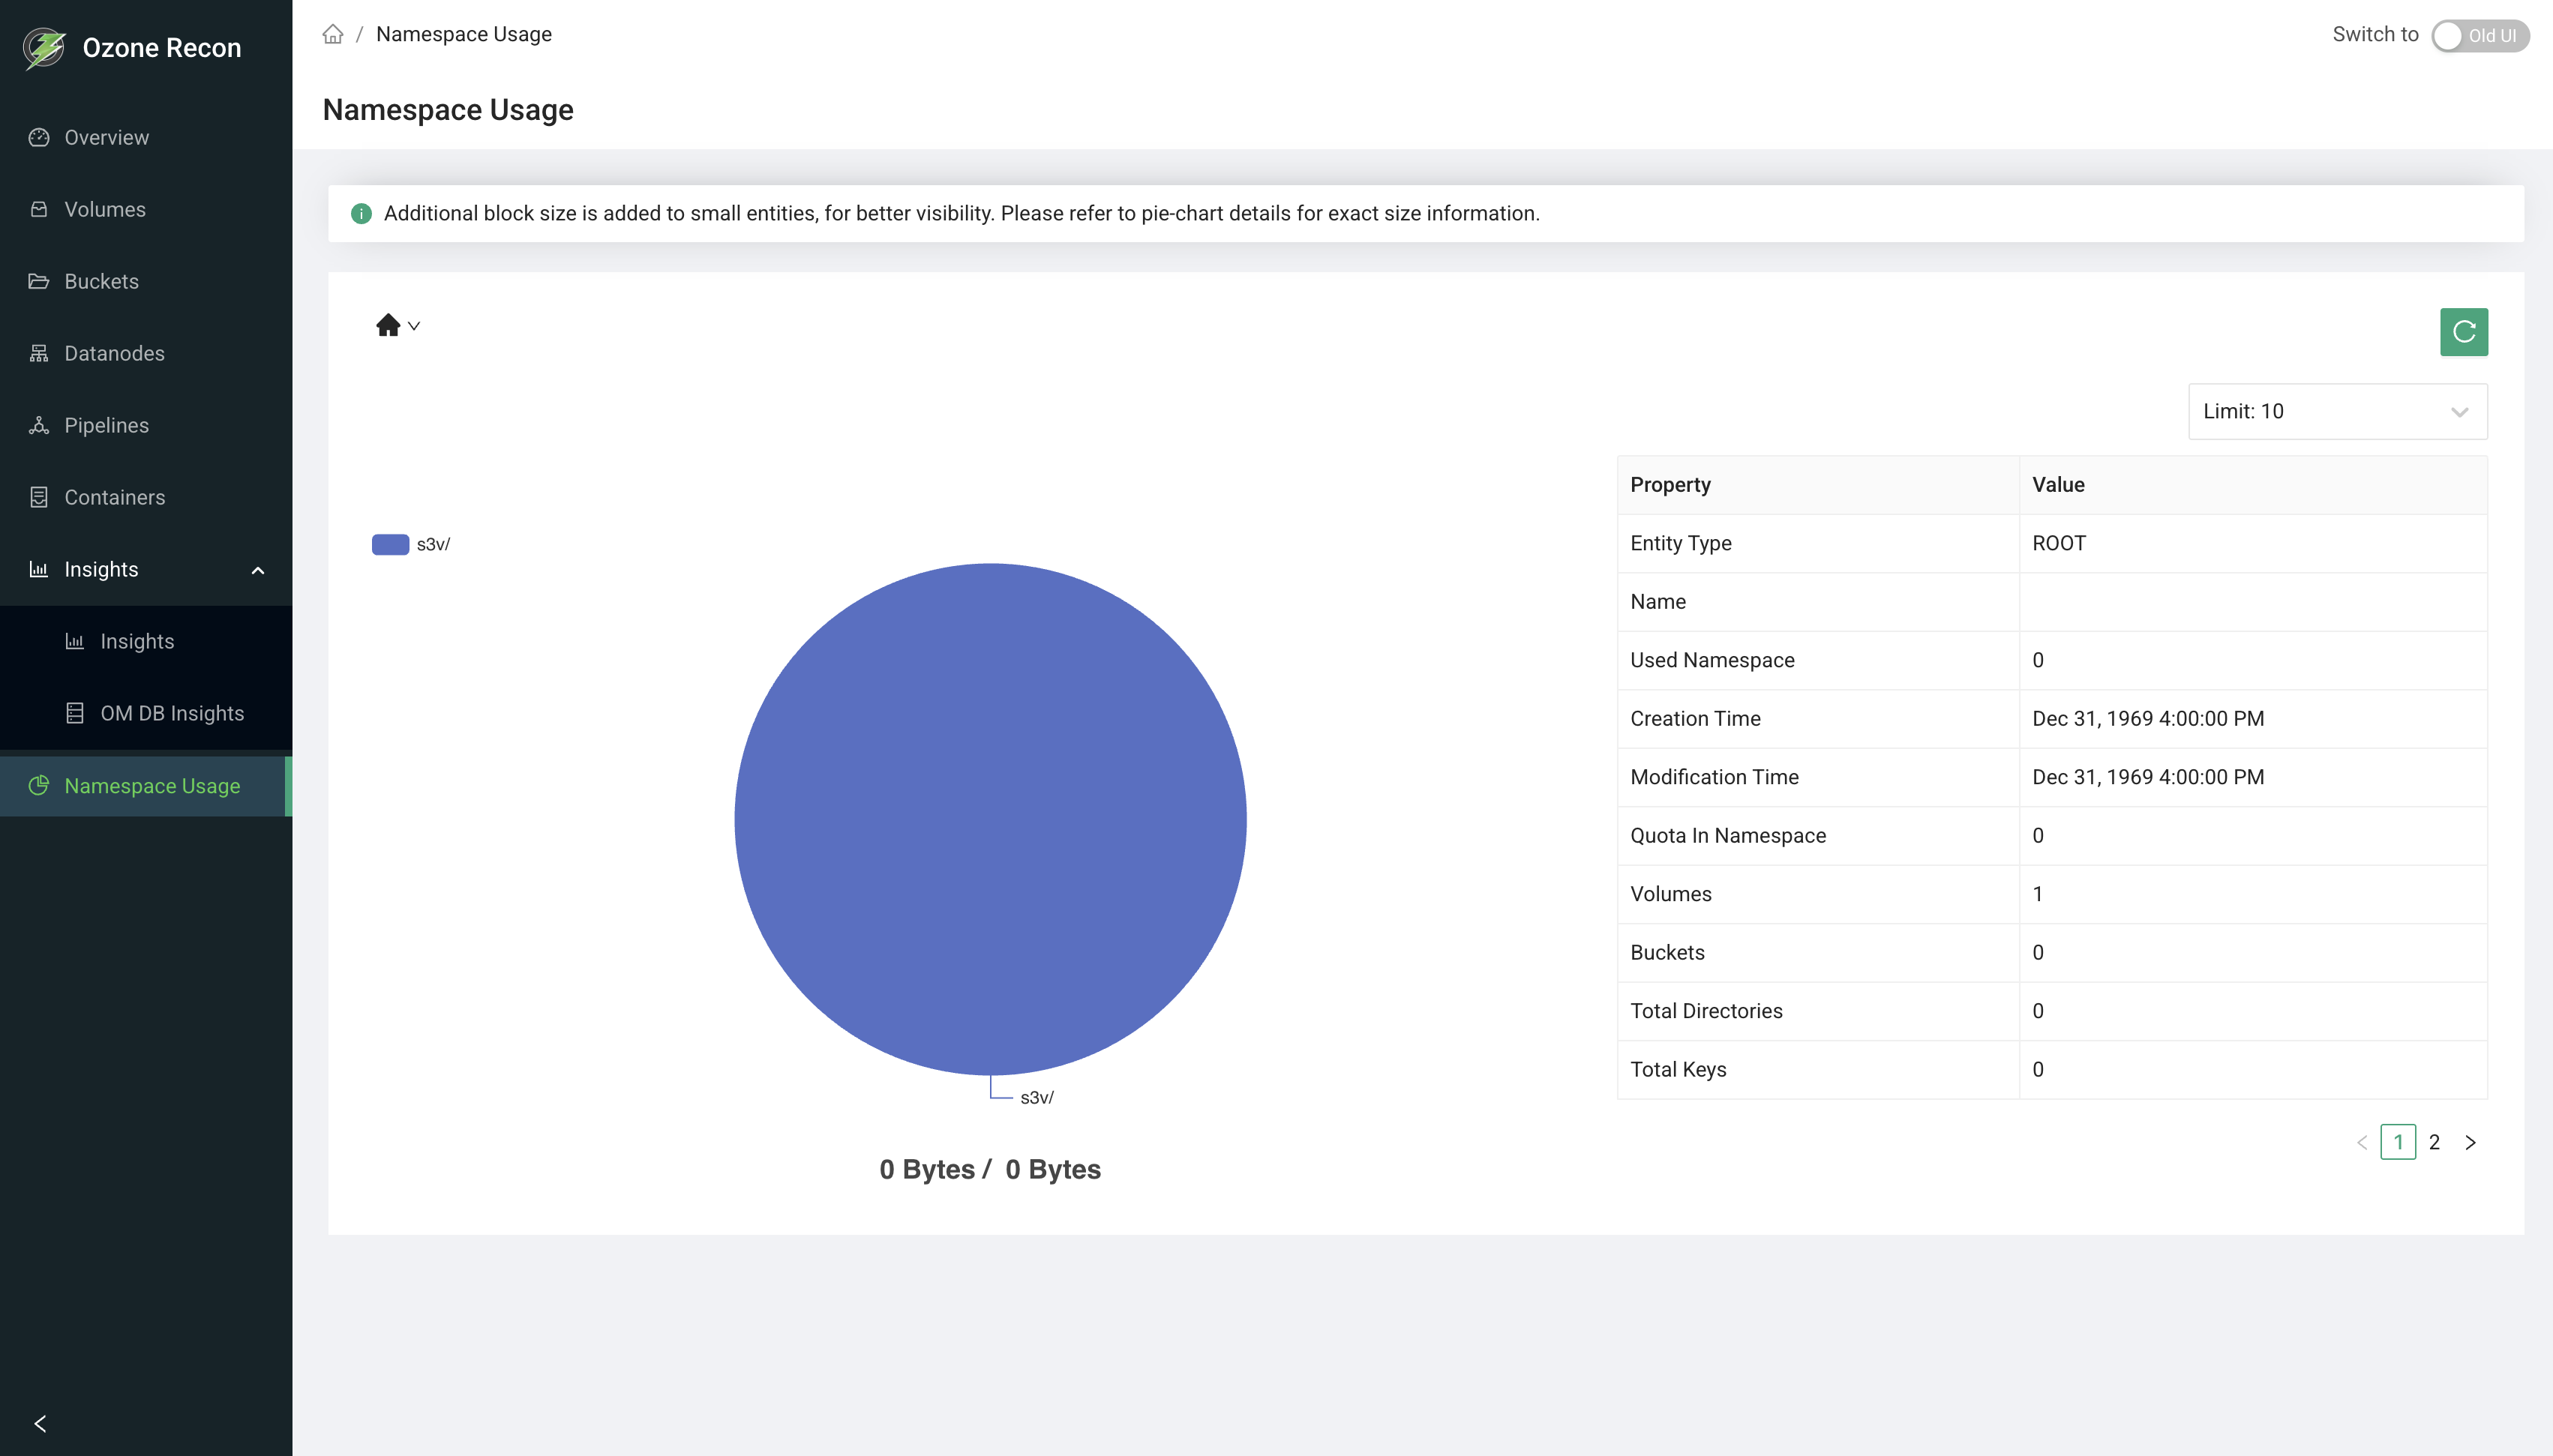
1. Page Overview
The Namespace Usage page (also called Disk Usage) lets you explore how storage is consumed across the Ozone namespace. Starting from a path, it shows a pie chart of the largest sub-paths by size and a metadata table describing the selected entity (volume, bucket, directory, or key). You can drill down into sub-paths to find what is using the most space.
It is an interactive, read-only explorer for capacity investigation at the namespace level.
2. When to Use This Page
- To find which volumes, buckets, or directories are consuming the most space.
- To drill down a path and locate large sub-directories or keys.
- To inspect the metadata and quota of a specific volume, bucket, directory, or key.
- To compare a path's logical size against its size with replication.
3. How to Access the Page
Open the Namespace Usage entry in the left navigation menu, or go to the
/NamespaceUsage route directly.
4. Information Displayed
The page header shows the title. Below it are informational banners, a breadcrumb navigator, a limit selector, a pie chart, and a metadata table.
Banners
- An info banner explaining that a small amount of extra block size is added to small entities in the chart for visibility, and that the pie-chart tooltip shows exact sizes.
- At the root path (
/), a warning banner noting that root-path usage can be expensive in large deployments and suggesting you enter an exact path.
Breadcrumb navigator
Shows the current path and lets you move up or down the namespace. Selecting a segment or sub-path reloads the chart and metadata for that location.
Pie chart
A pie of the current path's sub-paths by size:
- Each slice is a sub-path; keys are shown with no trailing slash and
directories with a trailing
/. - If there are more sub-paths than the selected limit (or leftover size beyond the shown slices), the remainder is grouped into an Other Objects slice.
- The chart title shows the currently selected size against the total (for
example,
12 GB / 40 GB). - Hovering a slice shows its exact Total Data Size and Percentage.
- Toggling slices in the chart updates the selected-size shown in the title.
Metadata table
A Property / Value table describing the current entity. Depending on the entity type, it can include:
- Entity Type (volume, bucket, directory, or key).
- Object information such as Volume, Bucket, Name, Owner, Storage Type, Bucket Layout, Used Namespace, and (for linked entities) Source Volume / Source Bucket.
- Creation Time and Modification Time.
- Used Bytes / Data Size.
- Quota In Namespace, Quota Allowed, and Quota Used (only when a quota is set).
- Replication details: Replication Factor, Replication Type, and Replication Required Nodes.
- Counts for container-like paths: Volumes, Buckets, Total Directories, Total Keys.
- For a key, a focused view with File Size and File Size With Replication plus creation and modification times.
5. Available Actions
- Breadcrumb navigation — click path segments or sub-paths to drill in and out.
- Limit selector — how many sub-paths to show as individual slices: 5, 10, 15, 20, or 30 (default 10). Sub-paths beyond the limit roll into Other Objects.
- Reload button — re-fetches usage for the current path. At the root path it re-triggers the root-path load confirmation.
- Load usage / root-path confirmation — at the root path, usage is not loaded automatically. You must click Load usage and confirm the "expensive operation" dialog before root usage is calculated.
- Pie-chart interactions — hover a slice for exact size and percentage; toggle slices to update the selected-size total.
6. How to Interpret the Information
- Slice size vs. Other Objects: the largest slices are the biggest consumers at the current level. A large Other Objects slice means much of the usage is spread across sub-paths beyond the selected limit — raise the limit or drill in to see them.
- Extra block size note: very small entities are padded slightly in the chart so they remain visible; always trust the tooltip's exact size over the slice's apparent area.
- Size vs. Size With Replication: the plain size is logical data; the replicated size reflects the physical space used after replication.
- Quota Allowed vs. Quota Used: how close the entity is to its configured quota; absent when no quota is set.
- Status messages:
- INITIALIZING — Recon is still building its namespace summary; wait and retry.
- PATH_NOT_FOUND / Invalid Path — the entered path does not exist.
7. Common Use Cases
- Find the biggest space consumer. Enter a bucket path, review the pie chart, and drill into the largest slice repeatedly until you reach the directory or key responsible.
- Inspect a specific key. Navigate to a key to see its File Size, File Size With Replication, and timestamps in the metadata table.
- Check quota headroom. Open a volume or bucket and compare Quota Used against Quota Allowed to decide whether to raise the quota.
8. Important Notes and Limitations
- Root path is not loaded by default. Because computing usage from
/can be expensive on large clusters, you must explicitly click Load usage and confirm. Entering an exact path loads directly without the prompt. - Data source and freshness. Usage, summary, and quota data come from Recon's namespace summary, which Recon builds from its copy of the Ozone Manager (OM) database. If it is still building, the page reports INITIALIZING; wait and retry.
- Limit affects the chart only. It controls how many sub-paths are drawn as individual slices; the rest are grouped into Other Objects.
- Small entities are visually padded in the chart; use the tooltip for exact values.
- On an invalid path or fetch error, the page shows an error notification.
9. Related Pages
- Volumes and Buckets — the entities whose usage you explore here.
- Overview — cluster-wide capacity and object totals.
- Capacity — cluster-level storage breakdown.