Recon UI — Pipelines Page
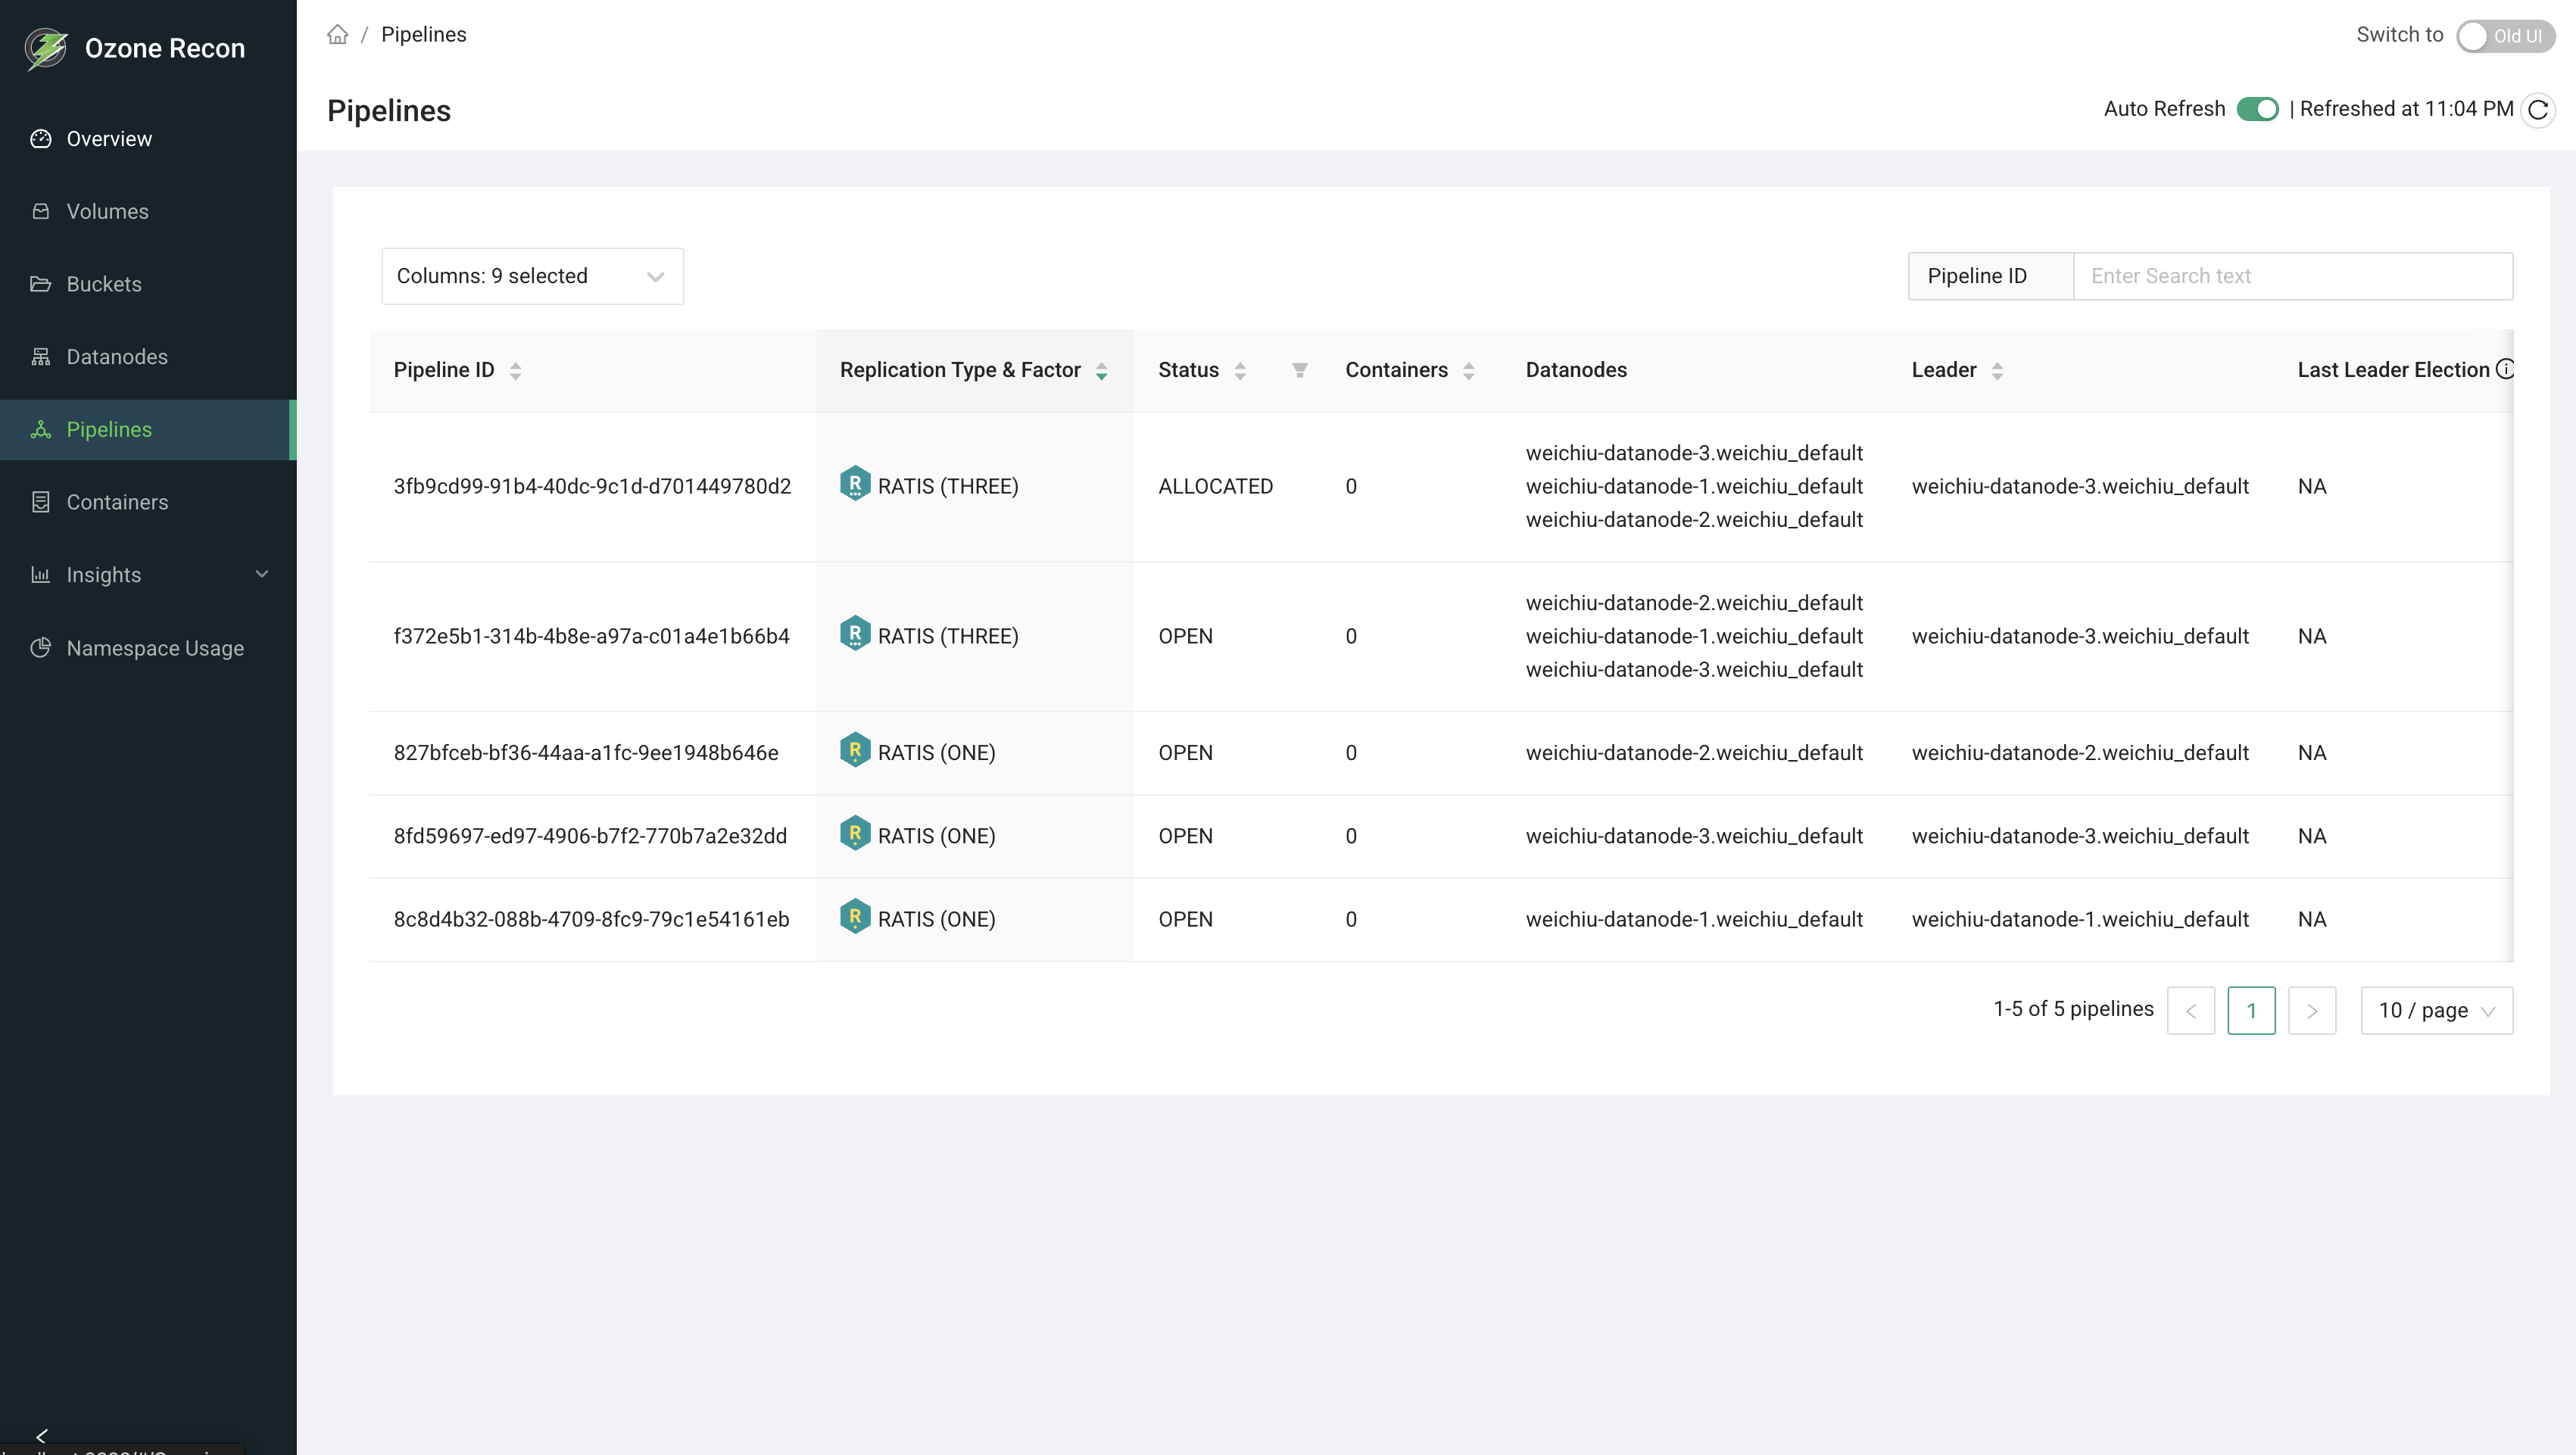
1. Page Overview
The Pipelines page lists the pipelines in your Ozone cluster. A pipeline is the group of datanodes that work together to store replicas of container data. For each pipeline the page shows its replication type and factor, status, the datanodes involved, the current leader, how long it has been alive, and leader-election metrics.
It is a read-only listing used to review pipeline health, replication, and datanode membership.
2. When to Use This Page
- To see all pipelines and their current status.
- To confirm replication type and factor across pipelines.
- To find which datanodes make up a pipeline and which one is the leader.
- To investigate pipelines that are not OPEN or that show frequent leader elections.
- To look up a specific pipeline by its ID.
3. How to Access the Page
Open the Pipelines entry in the left navigation menu, or go to the
/Pipelines route directly. You can also arrive here from the Pipelines
count card on the Overview page.
4. Information Displayed
The page header shows the title and an Auto Reload panel (see Available Actions). The main area is a table of pipelines, one row per pipeline.
Table columns
- Pipeline ID — the pipeline's unique identifier (always shown, pinned to the left). Sortable.
- Replication Type & Factor — the replication scheme (for example RATIS) and factor (for example 3), with a replication icon. Sortable.
- Status — the pipeline state: OPEN, CLOSING, QUASI_CLOSED, CLOSED, UNHEALTHY, INVALID, DELETED, or DORMANT. Filterable and sortable.
- Containers — the number of containers in the pipeline. Sortable.
- Datanodes — the datanodes that make up the pipeline, shown by hostname; hover a hostname to see its UUID.
- Leader — the datanode currently acting as the pipeline leader. Sortable.
- Last Leader Election — elapsed time since the current leader was elected.
Shows
NAunless a metrics provider such as Prometheus is configured. - Lifetime — how long the pipeline has been alive. Sortable.
- No. of Elections — the number of leader elections in the pipeline. Shows
NAunless a metrics provider such as Prometheus is configured.
5. Available Actions
- Columns selector — choose which columns are visible. Pipeline ID is always shown.
- Search — filter the shown rows by Pipeline ID; matching is a simple contains match on the loaded rows. Disabled when the table is empty.
- Status filter — filter to specific pipeline states from the Status column header.
- Sort — click a sortable column header.
- Pagination — page through results; page size is adjustable and the footer
shows the range and total (for example,
1-10 of 42 pipelines). - Auto Reload panel — an Auto Refresh toggle (refreshes every 60 seconds and remembers your choice for the session) and a manual reload button showing the last refreshed time.
- Datanode tooltip — hover a datanode hostname to see its UUID.
6. How to Interpret the Information
- Status OPEN: the pipeline is active and accepting writes. CLOSING / QUASI_CLOSED / CLOSED indicate the pipeline is being or has been shut down. UNHEALTHY, INVALID, DELETED, or DORMANT indicate pipelines that are not in normal service and may warrant investigation.
- Replication Type & Factor: confirms how many replicas the pipeline maintains (for example RATIS with factor 3 keeps three copies).
- Datanodes / Leader: shows exactly which nodes hold the pipeline and which one leads it. Cross-reference with the Datanodes page if a member node is unhealthy.
- Last Leader Election / No. of Elections: frequent elections can indicate
instability (for example a flaky leader node or network issues). These values
are only populated when a metrics provider is configured; otherwise they show
NAand are not an error.
7. Common Use Cases
- Spot unhealthy pipelines. Filter Status to values other than OPEN to quickly find pipelines that are closing, unhealthy, or invalid.
- Trace a pipeline's datanodes. Search for a Pipeline ID, then read the Datanodes and Leader columns to see which nodes hold its data.
- Investigate leader churn. With a metrics provider configured, sort by No. of Elections to find pipelines with excessive leader elections and correlate with datanode health.
8. Important Notes and Limitations
- Data source and freshness. Pipeline information comes from Recon's own SCM view, built from datanode reports. It is only as current as the last refresh, and Auto Refresh only re-queries Recon.
- Metrics columns need a metrics provider. Last Leader Election and
No. of Elections are populated only when a metrics service such as
Prometheus is configured for the cluster. Without it, these columns show
NA. - Search and filters apply to the loaded rows.
- On an error, the page reports a data-fetch error and the table stays empty.
9. Related Pages
- Datanodes — health and details of the datanodes that make up pipelines.
- Containers — the containers stored within pipelines.
- Overview — cluster-wide totals, including the pipeline count.