Recon UI — Insights Page
1. Page Overview
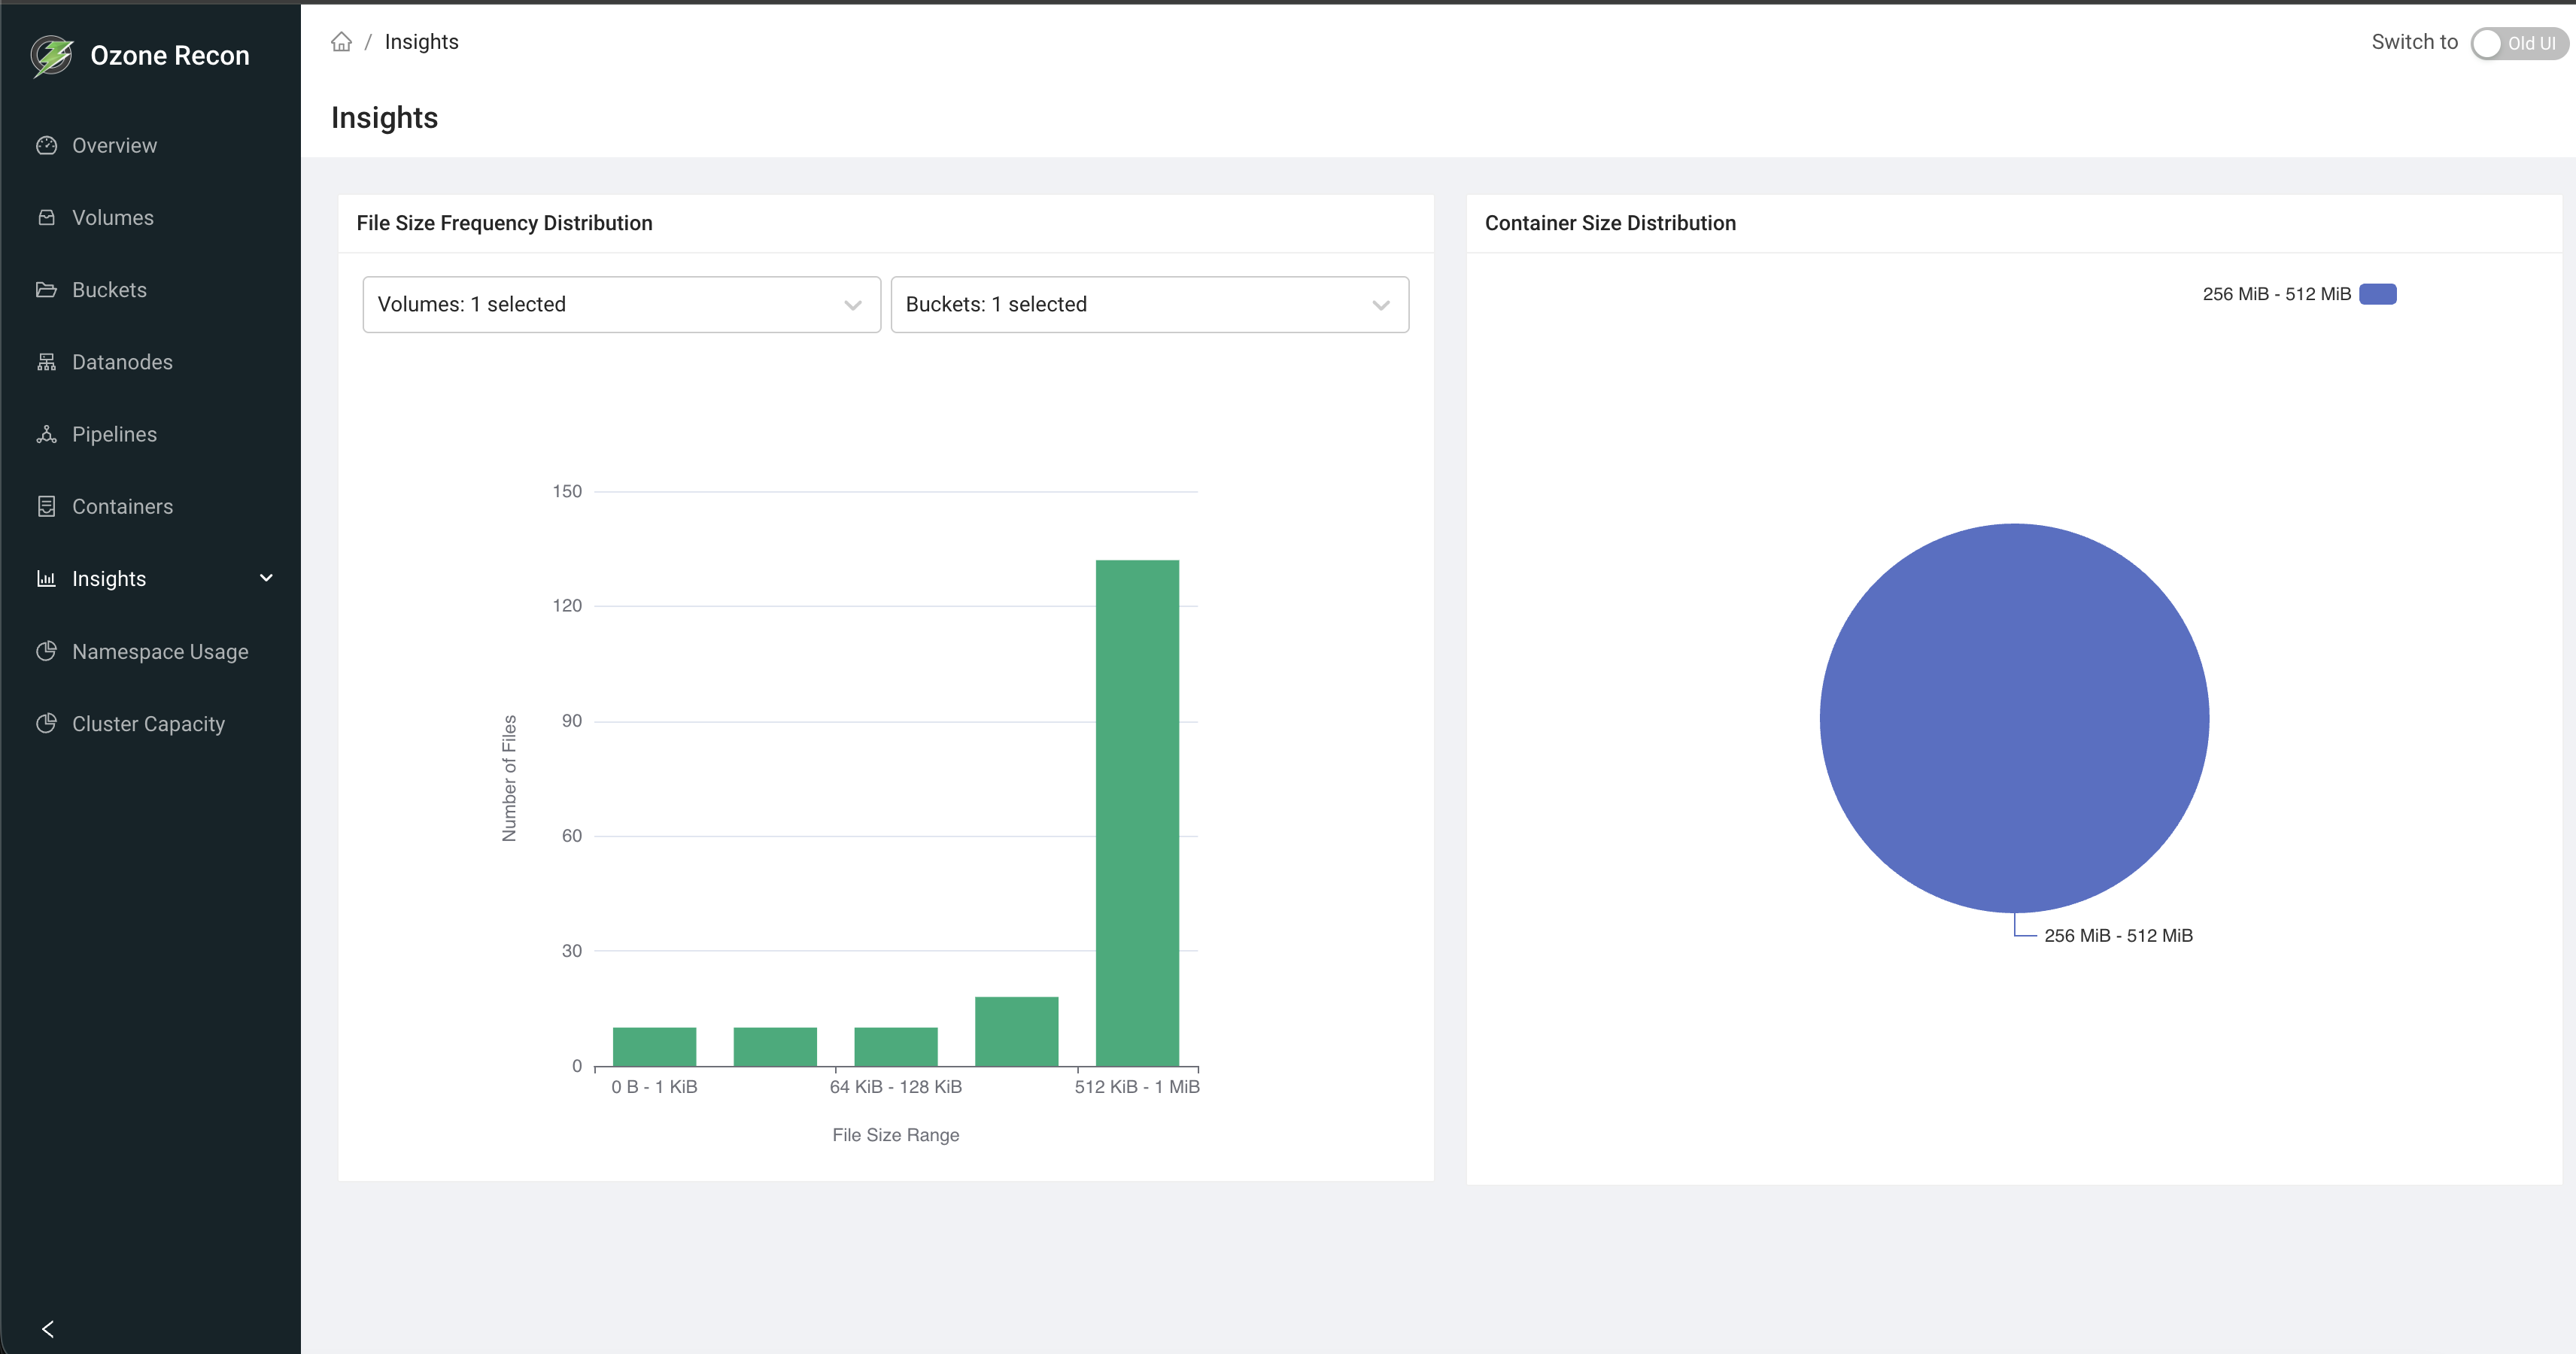
The Insights page visualizes how data is distributed across the cluster by size. It shows two charts: a File Size Frequency Distribution (how many files fall into each size range) and a Container Size Distribution (how containers are spread across size ranges). The file chart can be narrowed to specific volumes and buckets.
It is a read-only analytics page for understanding data-size patterns — for example, whether the cluster is dominated by many small files or a few large ones.
Note: this is the Insights page. A separate OM DB Insights page covers open keys, keys pending deletion, and related OM database details.
2. When to Use This Page
- To understand the file-size profile of the cluster or of a specific bucket.
- To detect a "small files problem" (a very high count of tiny files).
- To see how containers are distributed by size.
- To compare data-size patterns between volumes or buckets.
3. How to Access the Page
Open the Insights entry in the left navigation menu, or go to the
/Insights route directly.
4. Information Displayed
The page header shows the title. While data loads, a "Charts are being loaded" message is shown. Once loaded, two cards appear side by side.
File Size Frequency Distribution (bar chart)
- A bar chart where the x-axis is the file-size range (for example
512 KiB - 1 MiB) and the y-axis is the Number of Files in that range. - Ranges are power-of-two size buckets; hovering a bar shows the exact size range and count.
- Two filters above the chart:
- Volumes — multi-select (with search and select-all) to include specific volumes.
- Buckets — multi-select, enabled only when exactly one volume is selected; it lists that volume's buckets.
Container Size Distribution (pie chart)
- A pie chart of containers grouped into size ranges; each slice is a range and its value is the number of containers in that range.
- Hovering a slice shows the size range and container count.
- This chart has no volume/bucket filter (containers are not tied to a single bucket).
5. Available Actions
- Volumes filter (file chart) — choose which volumes to include; supports search and select-all.
- Buckets filter (file chart) — choose buckets within a single selected volume. It is disabled when more than one volume is selected (unless the cluster has only one volume).
- Chart tooltips — hover any bar or slice for the exact size range and count.
There is no auto-refresh panel, search box, table, or download on this page.
6. How to Interpret the Information
- Tall bars at small size ranges: many small files. A very large count of tiny files can hurt performance and metadata scaling (the "small files problem").
- Bars concentrated at large size ranges: the cluster is dominated by large files.
- Container pie skewed to small ranges: many small or partially filled containers; skewed to large ranges means containers are well filled.
- Filtering the file chart: select a single volume, then its buckets, to see the size profile for just that bucket — useful for comparing workloads.
- "No Data" result: the corresponding metric has no data yet (for example a new cluster with no files). This is expected, not an error.
- Error banner inside a chart ("No data available. …"): the underlying data could not be fetched.
7. Common Use Cases
- Diagnose a small-files problem. Open the file chart for the whole cluster and check whether the smallest size ranges dominate the file count.
- Profile one bucket. Select a single volume and one of its buckets to see that bucket's file-size distribution in isolation.
- Assess container fill. Use the container pie chart to judge whether containers are mostly small (poorly filled) or large (well filled).
8. Important Notes and Limitations
- Data source and freshness. Both charts are built from counts Recon maintains in its own database (file-count-by-size and container-count-by-size), populated by Recon background tasks that process its copy of the Ozone Manager (OM) data and container information. The charts reflect the last time those tasks ran, not real time.
- Bucket filter needs a single volume. The Buckets filter is only active when exactly one volume is selected; with multiple volumes it is disabled.
- Size ranges are power-of-two buckets, so exact per-file sizes are not shown — only how many files fall into each range.
- The page has no manual refresh control; reload the page to re-fetch.
- On no data, each chart shows a "No Data" message independently.
9. Related Pages
- OM DB Insights — open keys, keys pending deletion, and OM database details.
- Namespace Usage — size usage explored by path rather than by size range.
- Containers — container health and per-state detail.
- Overview — cluster-wide totals.