Recon UI — Overview Page
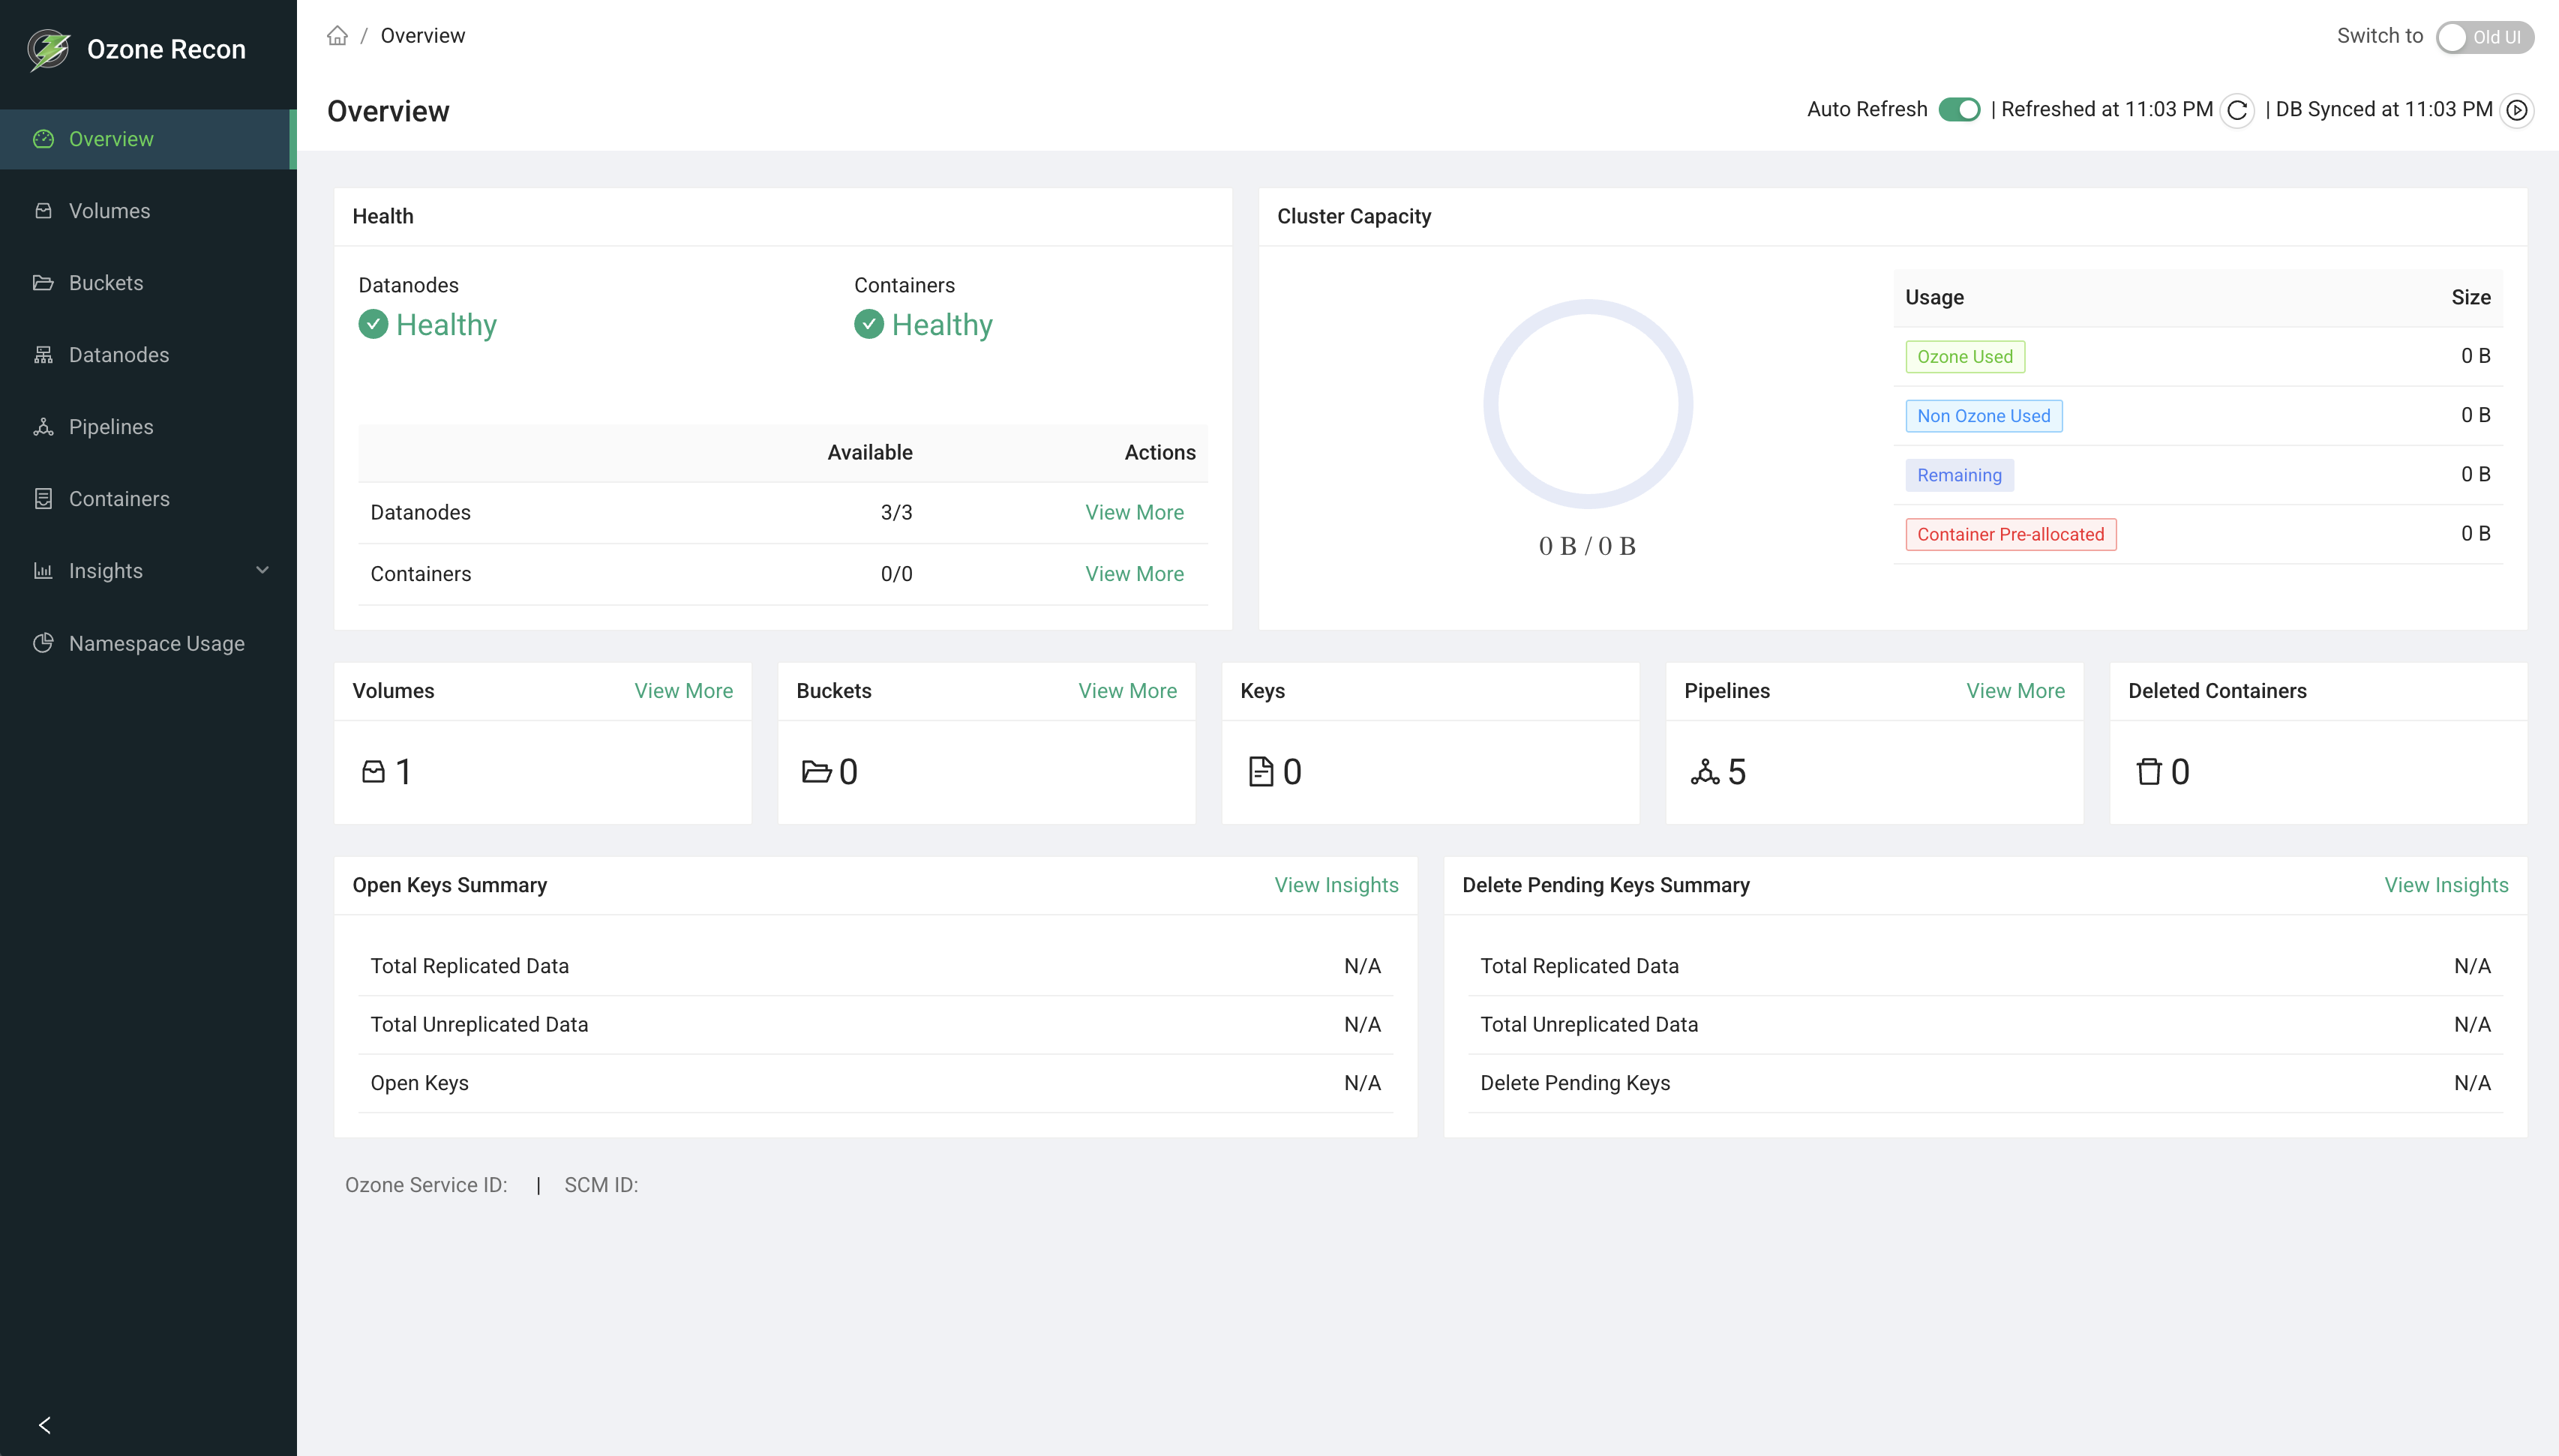
1. Page Overview
The Overview page is the Recon landing page. It gives you an at-a-glance summary of the health and size of your Ozone cluster: datanode and container health, total storage capacity and how it is being used, counts of the main objects (volumes, buckets, keys, pipelines, containers), and summaries of open and delete-pending keys.
It is a read-only dashboard, and every card links to a more detailed page, so the Overview is the usual starting point for any investigation.
2. When to Use This Page
- As your first stop after logging in, to confirm the cluster is healthy.
- To quickly spot missing containers or unhealthy datanodes.
- To check how full the cluster is (used vs. remaining capacity).
- To see whether there is a large backlog of open keys or keys pending deletion.
- To confirm the data Recon is showing is recent, and to trigger an on-demand sync from the Ozone Manager (OM).
3. How to Access the Page
The Overview page is shown by default when you open the Recon web UI. You can also reach it any time from the Overview entry in the left navigation menu.
4. Information Displayed
At the top of the page is the page title and an Auto Reload panel (described under Available Actions). At the bottom, the Ozone Service ID and SCM ID are shown for reference.
Health cards
Two cards, each showing a Health status (Healthy or Unhealthy) and an
Availability ratio in the form available/total:
- Datanodes — healthy datanodes out of the total. Links to the Datanodes page.
- Containers — available containers out of the total (total minus missing). Links to the Containers page.
A card is Healthy only when every unit is accounted for (available equals total). Otherwise it shows Unhealthy.
Ozone Capacity card
A storage breakdown with a stacked bar and a View More link to the Capacity page. It shows:
- TOTAL — the space configured for Ozone to use in the cluster. The actual disk space may be larger than what is allocated to Ozone.
- OZONE USED SPACE — space used by data stored in Ozone.
- OTHER USED SPACE — space occupied by other Ozone-related files (logs, configuration, database files, and so on) rather than stored data.
- CONTAINER PRE-ALLOCATED — space committed/pre-allocated but not yet written.
Count cards
Six single-number cards:
- Volumes — total volumes (links to the Volumes page).
- Buckets — total buckets (links to the Buckets page).
- Keys — total keys in the cluster.
- Pipelines — total pipelines (links to the Pipelines page).
- Deleted Containers — containers in the deleted state.
- Open Containers — containers in the open state.
Summary tables
Two tables, each with Name and Size columns and a View More link to the OM DB Insights page:
- Open Keys Summary — Total Replicated Data, Total Unreplicated Data, and the number of Open Keys.
- Delete Pending Keys Summary — Total Replicated Data, Total Unreplicated Data, and the number of Delete Pending Keys.
Values that are unavailable appear as N/A.
5. Available Actions
The Auto Reload panel in the header provides:
- Auto Refresh toggle — turns automatic refresh on or off. It refreshes every 60 seconds and remembers your choice for the session.
- Refreshed at
<time>with a reload button — refreshes all data on the page immediately. - DB Synced at
<time>with a sync button — triggers an on-demand OM DB sync. Hovering over the time shows when the last delta and full updates happened, and whether a sync was just triggered or was already running.
Each health, capacity, and summary card also has a View More link that takes you to the detailed page for that topic. There is no search, filter, sort, pagination, or download on this page.
6. How to Interpret the Information
- Health = Healthy (green check): all units are accounted for. Unhealthy (yellow warning): at least one datanode is not healthy or at least one container is missing — use View More to drill down.
- Missing containers indicate a data-availability risk; investigate on the Containers page. The count is capped at 1001, so a value of 1001 means "1001 or more".
- Ozone Capacity: compare OZONE USED SPACE against TOTAL to judge how full the cluster is. A large OTHER USED SPACE means non-data files are consuming disk. CONTAINER PRE-ALLOCATED is space reserved but not yet written.
- Open Keys Summary: a large open-keys count or size can indicate many in-progress writes, or leaked/abandoned open keys.
- Delete Pending Keys Summary: a growing backlog can indicate that deletion is falling behind.
- N/A means the value was unavailable, which is not necessarily the same as zero.
7. Common Use Cases
- Daily health check. Confirm both health cards show Healthy and capacity is within expectations. If a card is Unhealthy, click View More to investigate.
- Capacity planning. Watch OZONE USED SPACE against TOTAL over time to decide when to add datanodes, then use View More → Capacity for the per-datanode breakdown.
- Deletion backlog triage. If Delete Pending Keys is high, click View More to the OM DB Insights page to see the keys involved.
8. Important Notes and Limitations
- Data freshness. Volume, bucket, and key counts and the key summaries come from Recon's own copy of the OM database, which is updated by a periodic sync. The "DB Synced at" time shows how current that data is; use the sync button to force an update. Datanode, container, and capacity numbers depend on datanode reports and heartbeats.
- Auto Refresh only re-queries Recon; it does not force Recon to re-sync from OM. It runs every 60 seconds by default.
- Capacity is based on datanode reports and includes replicated data size. If some datanodes have not reported yet, capacity may be incomplete.
- On an error, a card shows an error state instead of values. Until the first successful load, counts appear as zero or N/A.
- The Ozone Service ID and SCM ID come from cluster configuration and may show N/A if they are not configured.
9. Related Pages
- Datanodes — detail behind the Datanodes health card.
- Containers — detail behind the Containers health card and missing-container investigations.
- Capacity — full storage and capacity breakdown.
- Volumes, Buckets, Pipelines — detail behind the count cards.
- OM DB Insights — detail behind the Open Keys and Delete Pending Keys summaries.